Search
MammalTIS provides three search modes to help users access translation initiation site information from different entry points.
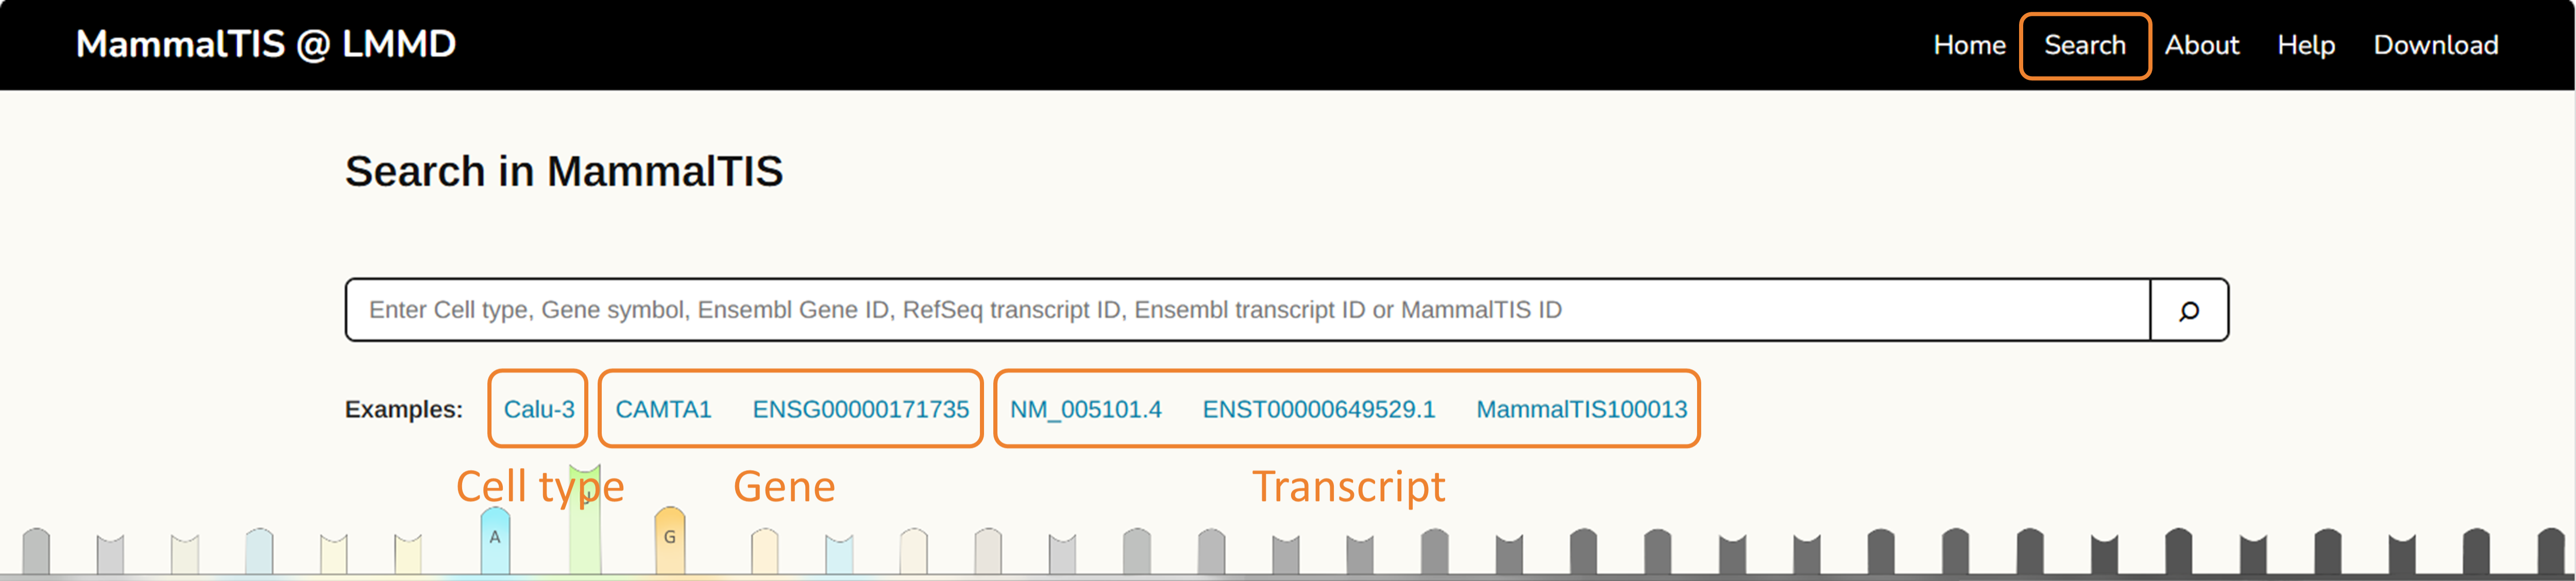
1.Search by cell
Users can search by cell type to browse genes with candidate translation initiation sites detected in the selected cell type.
| Species | Cell types | |||||
|---|---|---|---|---|---|---|
| Human | Calu-3 | HEK | HCT116 | MCF10A-ER-Src | BJ | Jurkat T-lymphocytes |
| HeLa-S3 | K562 | CD19+ B cells | SUM1315 | |||
| Mouse | Liver cells | MEF cells | Embryonic stem cells | Skeletal cells | Keratinocytes | Erythroblasts |
| BMDCs | Kidney cells | Lung cells | Heart cells | Testis cells | ||
2.Search by gene
Users can search a gene using either a Gene symbol or an Ensembl gene ID.
3.Search by transcript
Users can directly search a transcript using a RefSeq transcript ID, an Ensembl transcript ID, or the database-specific identifier MammalTIS ID.
MammalTIS cell page
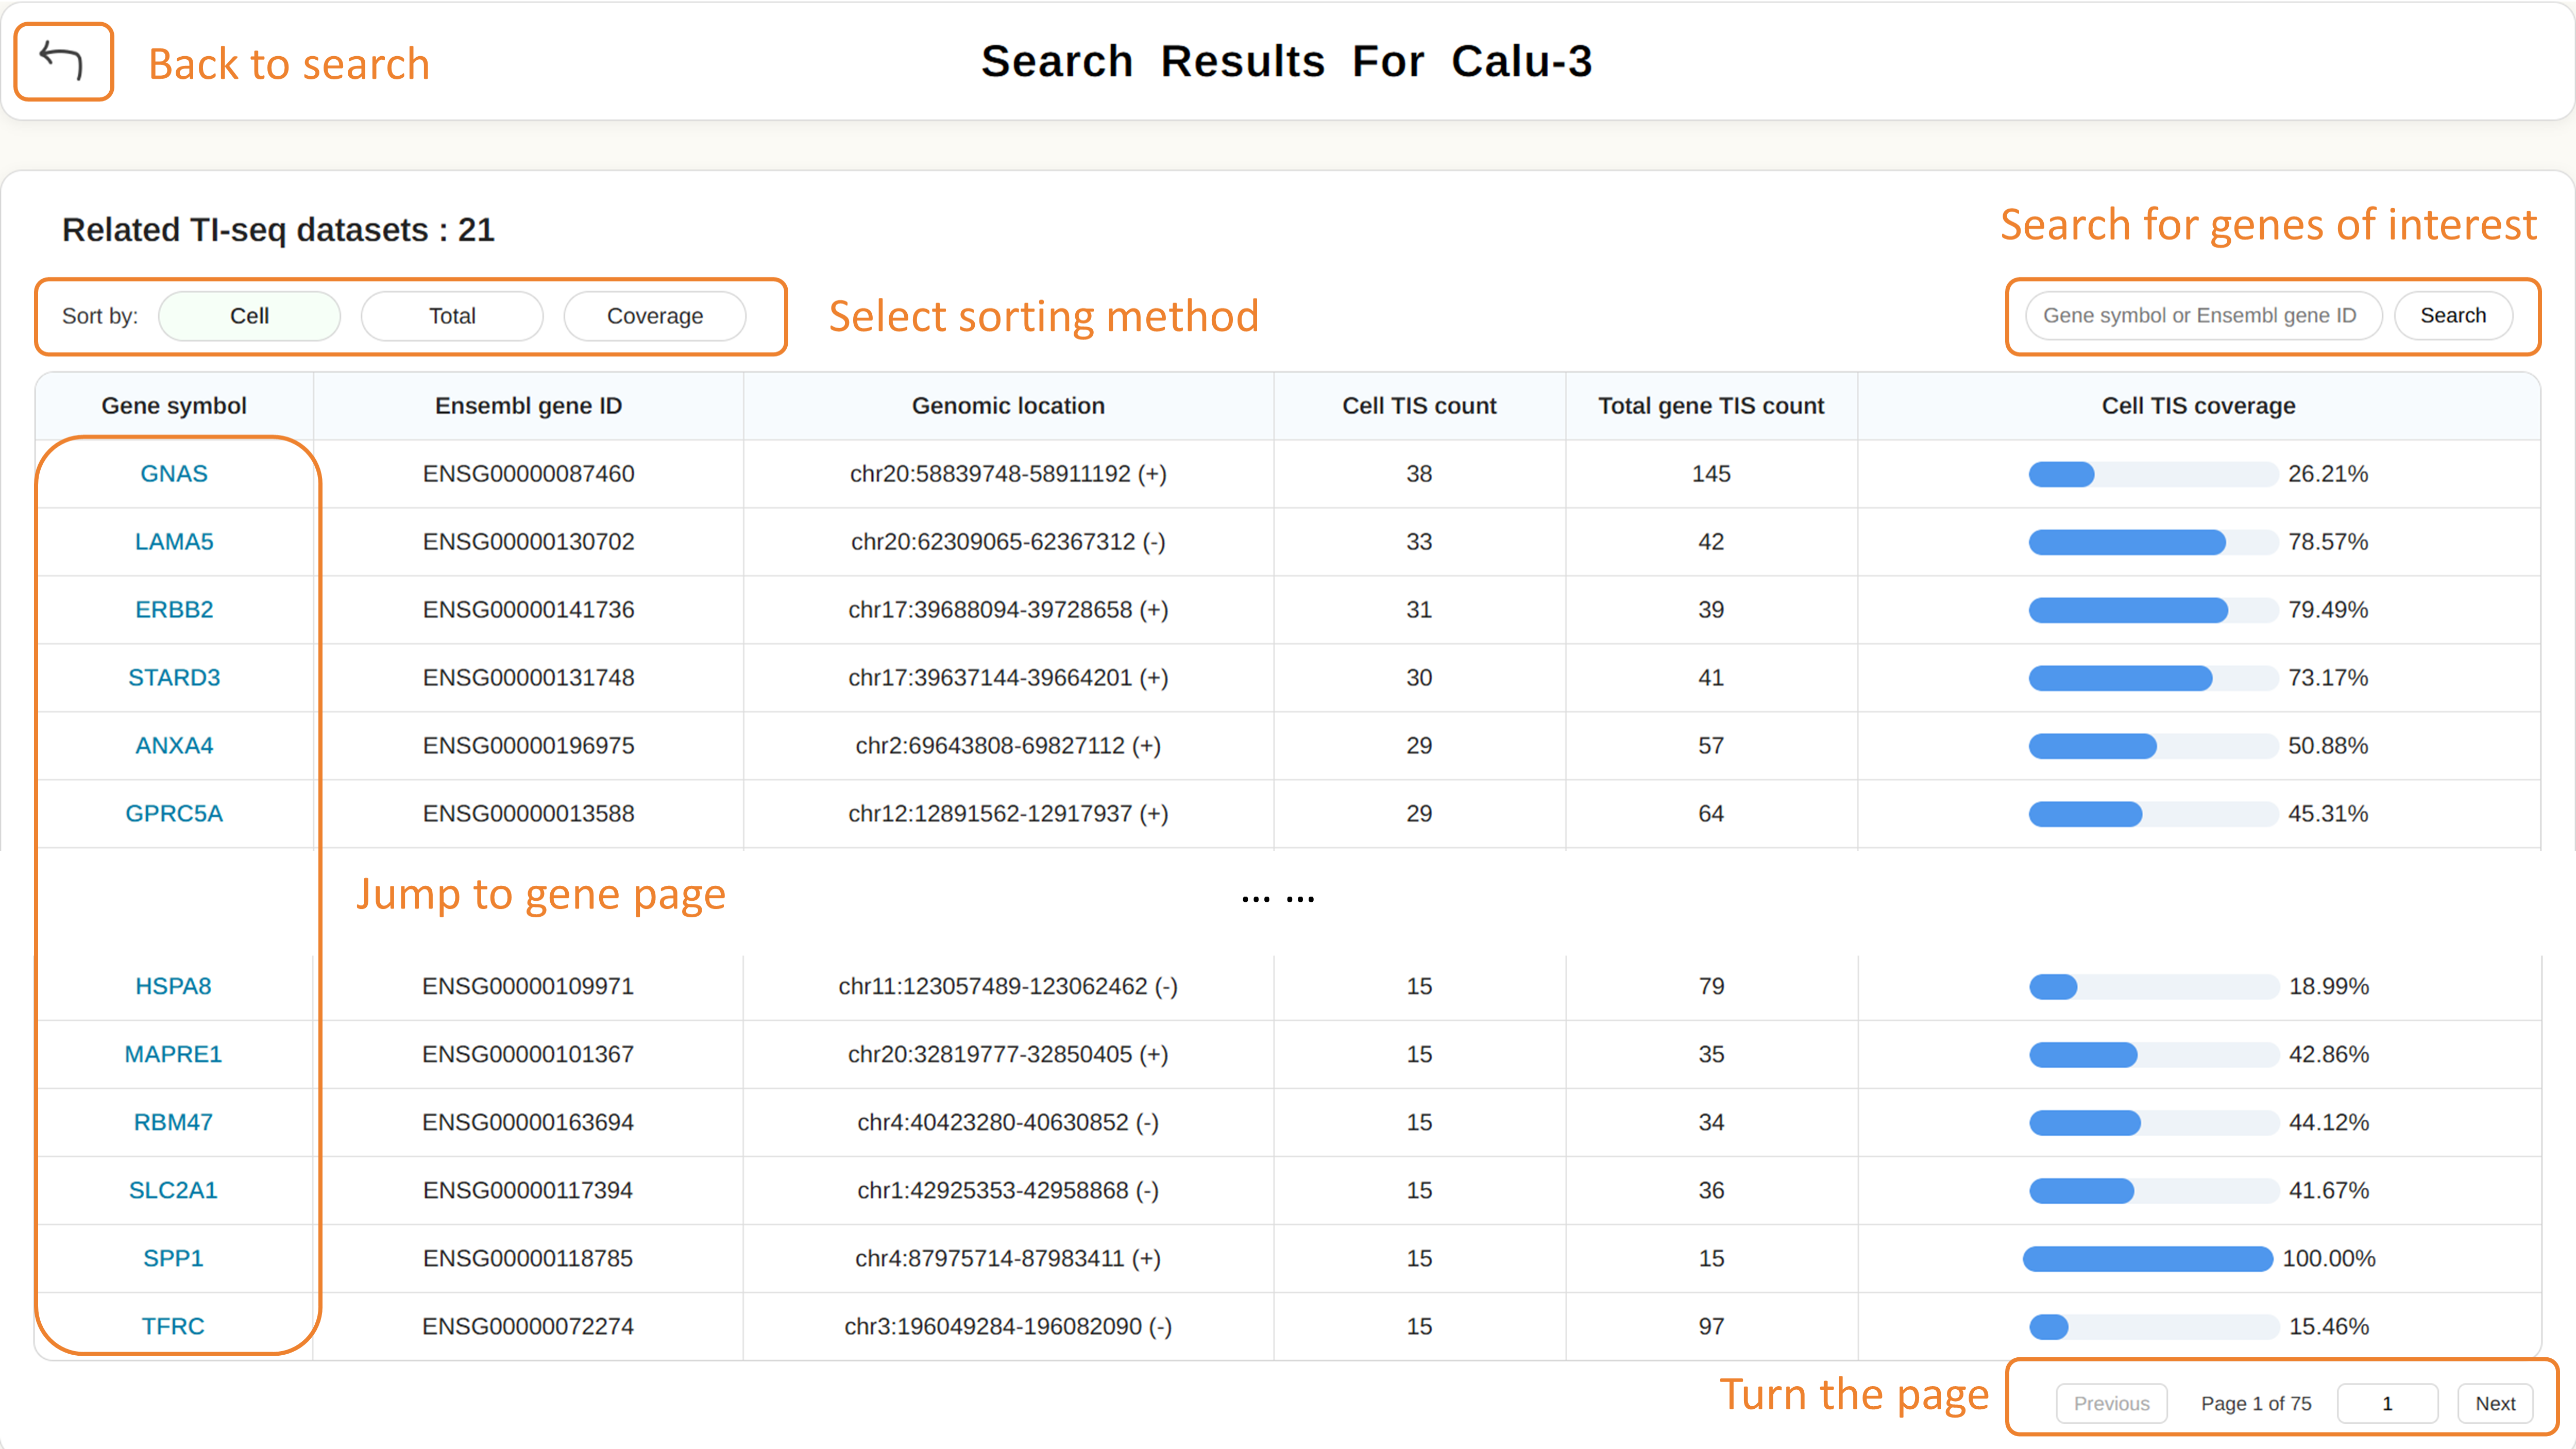
The MammalTIS cell page lists genes with candidate translation initiation sites detected in a selected cell type, together with gene identifiers, genomic locations, gene-level TIS counts, and Cell type TIS fraction. Users can sort the results or search a gene of interest to quickly access the corresponding gene page.
MammalTIS gene page
1.Gene information
This part provides basic information for the selected gene.
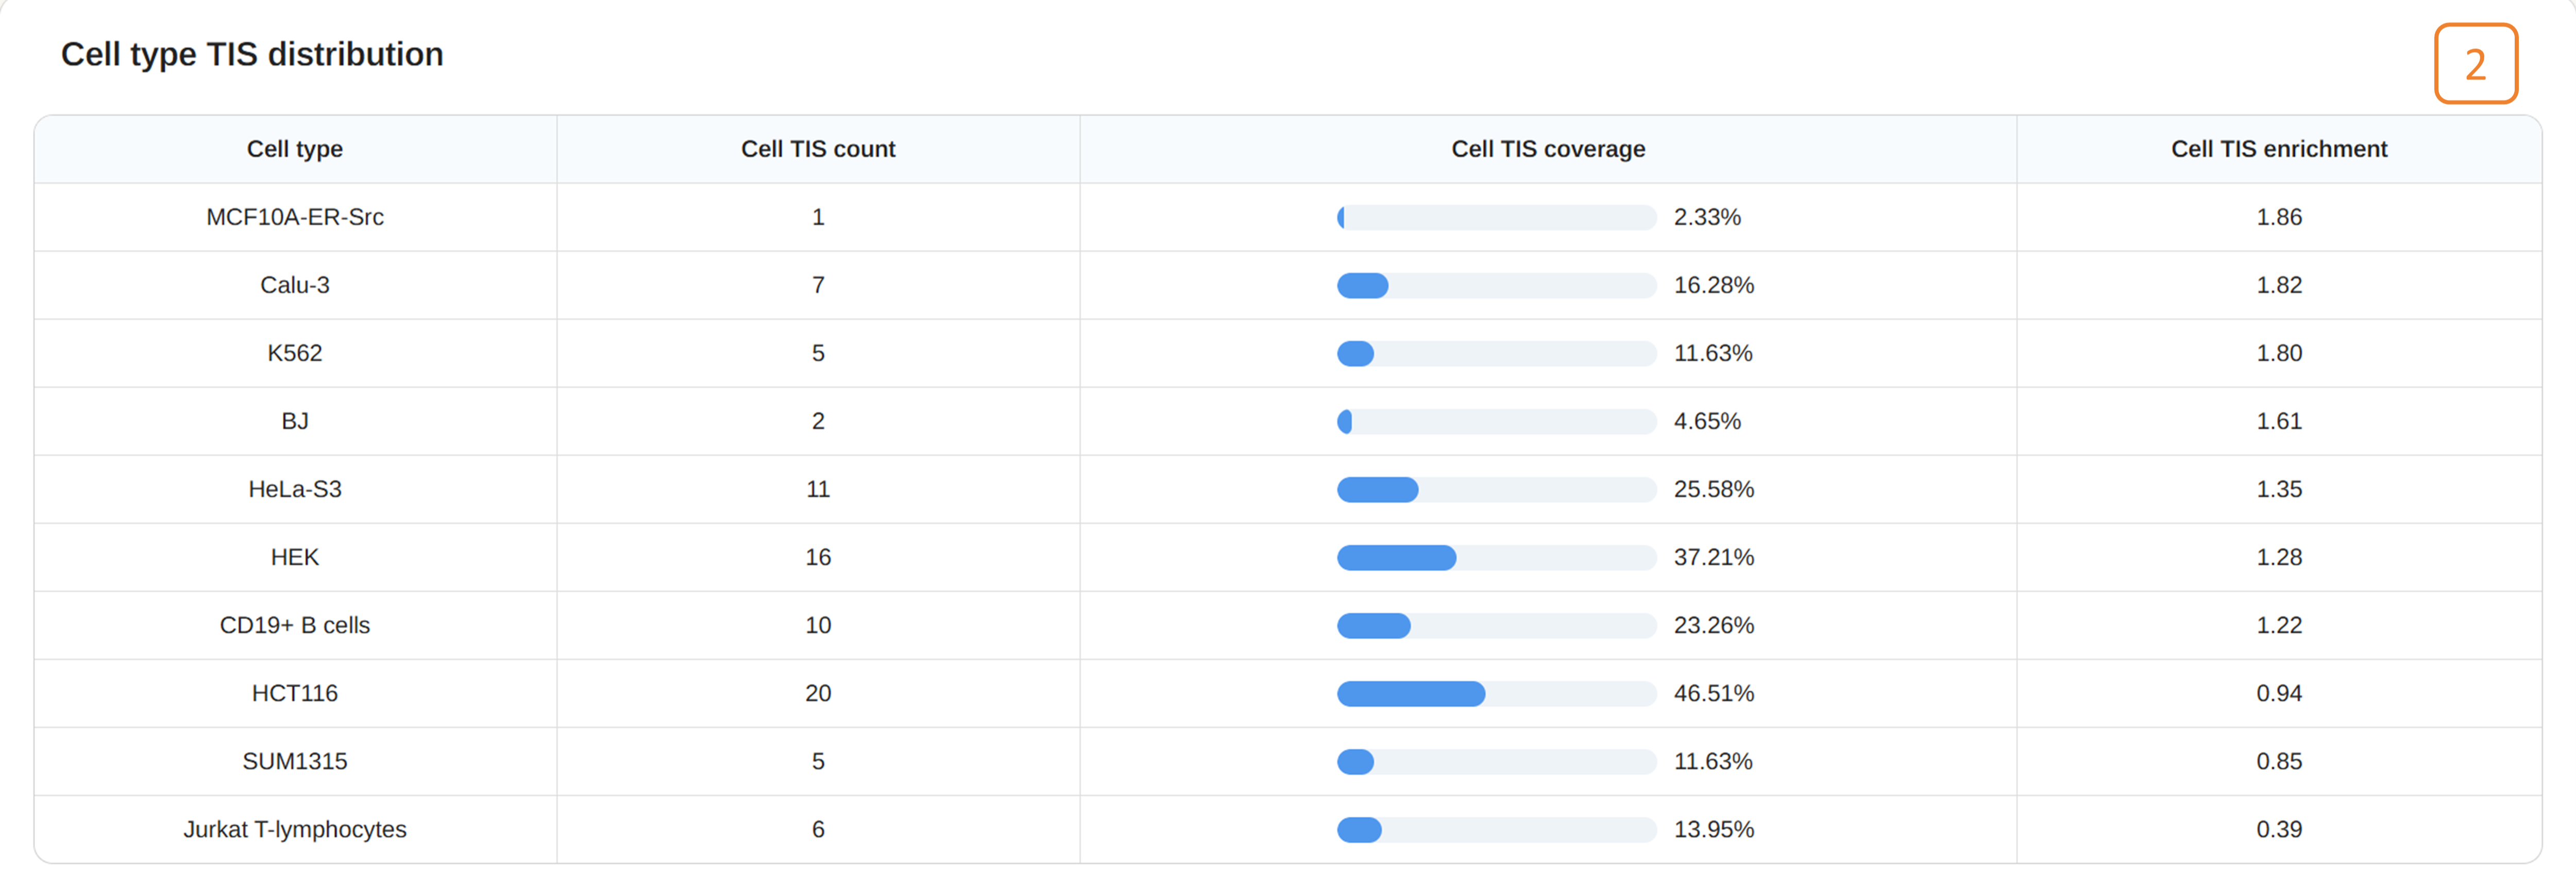
2.Cell type TIS distribution
This part summarizes the distribution of candidate translation initiation sites across cell types.
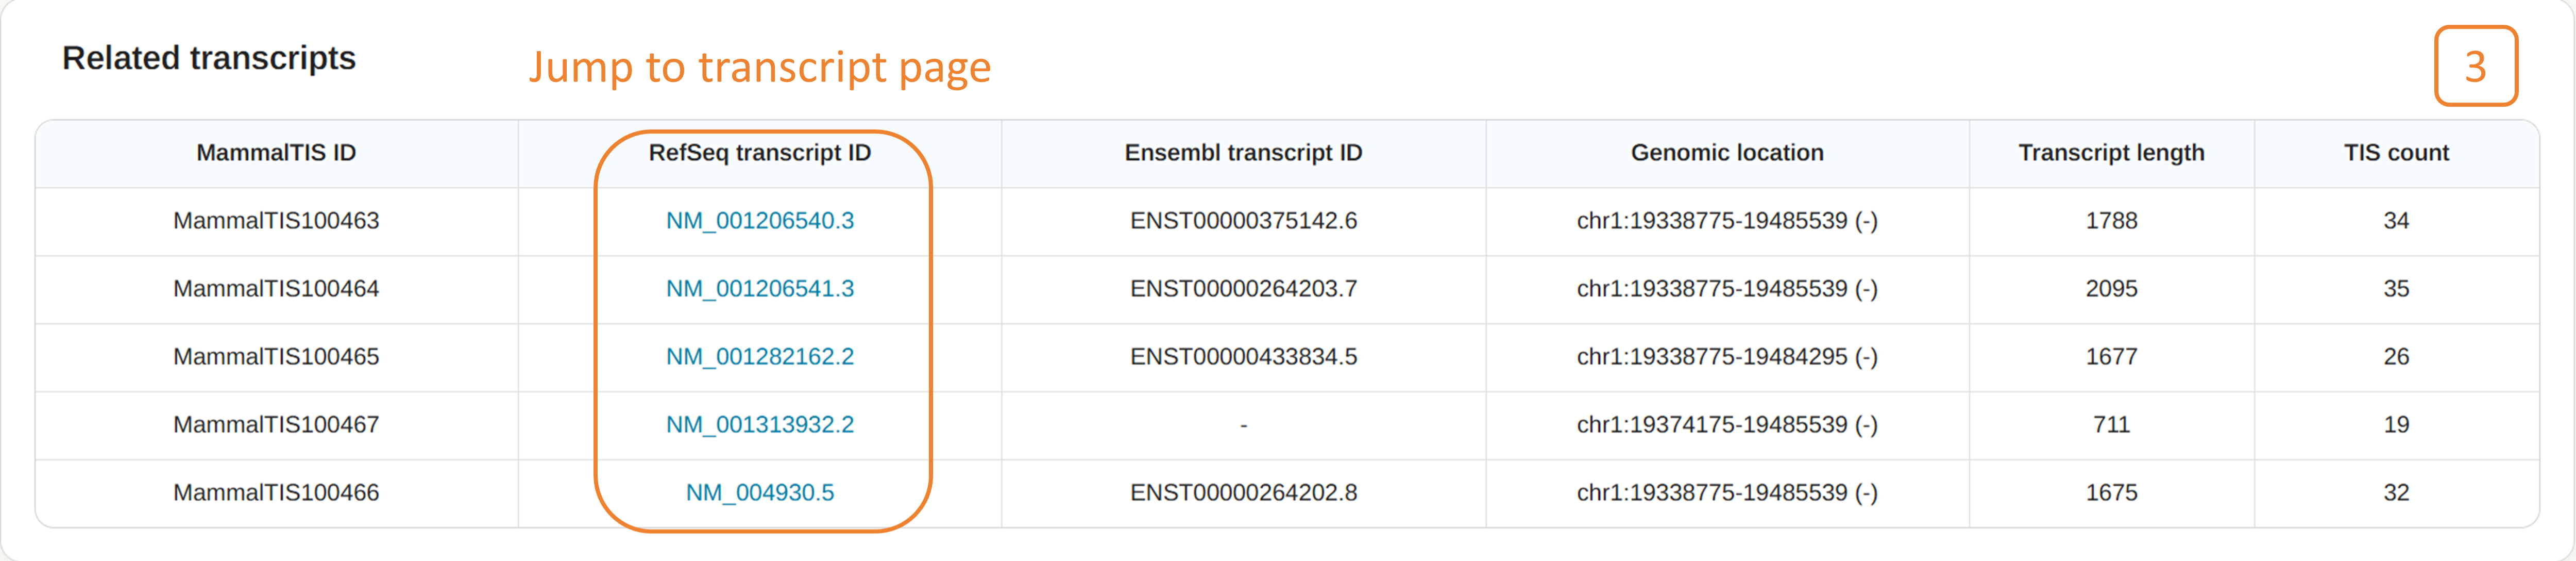
3.Related transcripts
This part lists the transcripts associated with the selected gene. Users can click the transcript ID to jump to the corresponding transcript page.

MammalTIS transcript page
1.Transcript information
This part provides basic information for the selected transcript, including MammalTIS ID, gene symbol, Ensembl gene ID, RefSeq transcript ID, Ensembl transcript ID, genomic location, transcript length, annotated start and stop codons, and the number of candidate start codons.
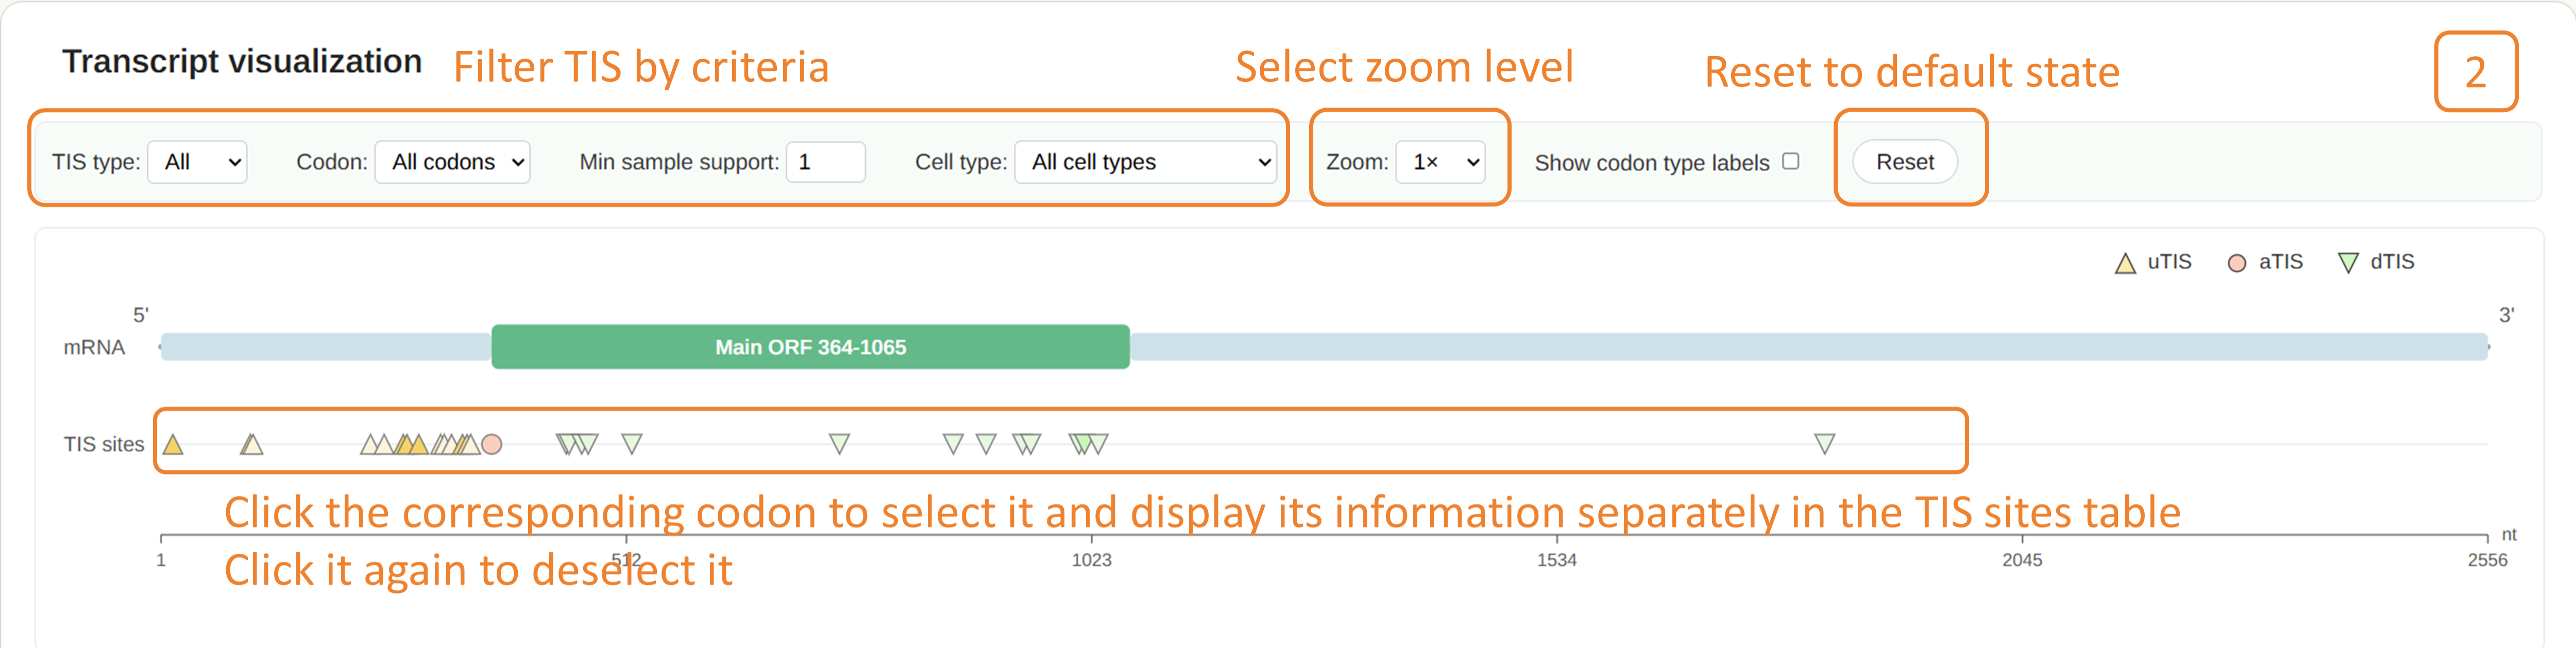
2.Transcript visualization
This part displays candidate TISs along the transcript together with the main ORF. Users can filter TISs by TIS type, codon, minimum sample support, and cell type, select a zoom level, show or hide codon type labels, and reset the visualization to the default state. Clicking a TIS marker in the visualization selects the corresponding site and displays its information separately in the TIS sites table; clicking it again deselects the site.
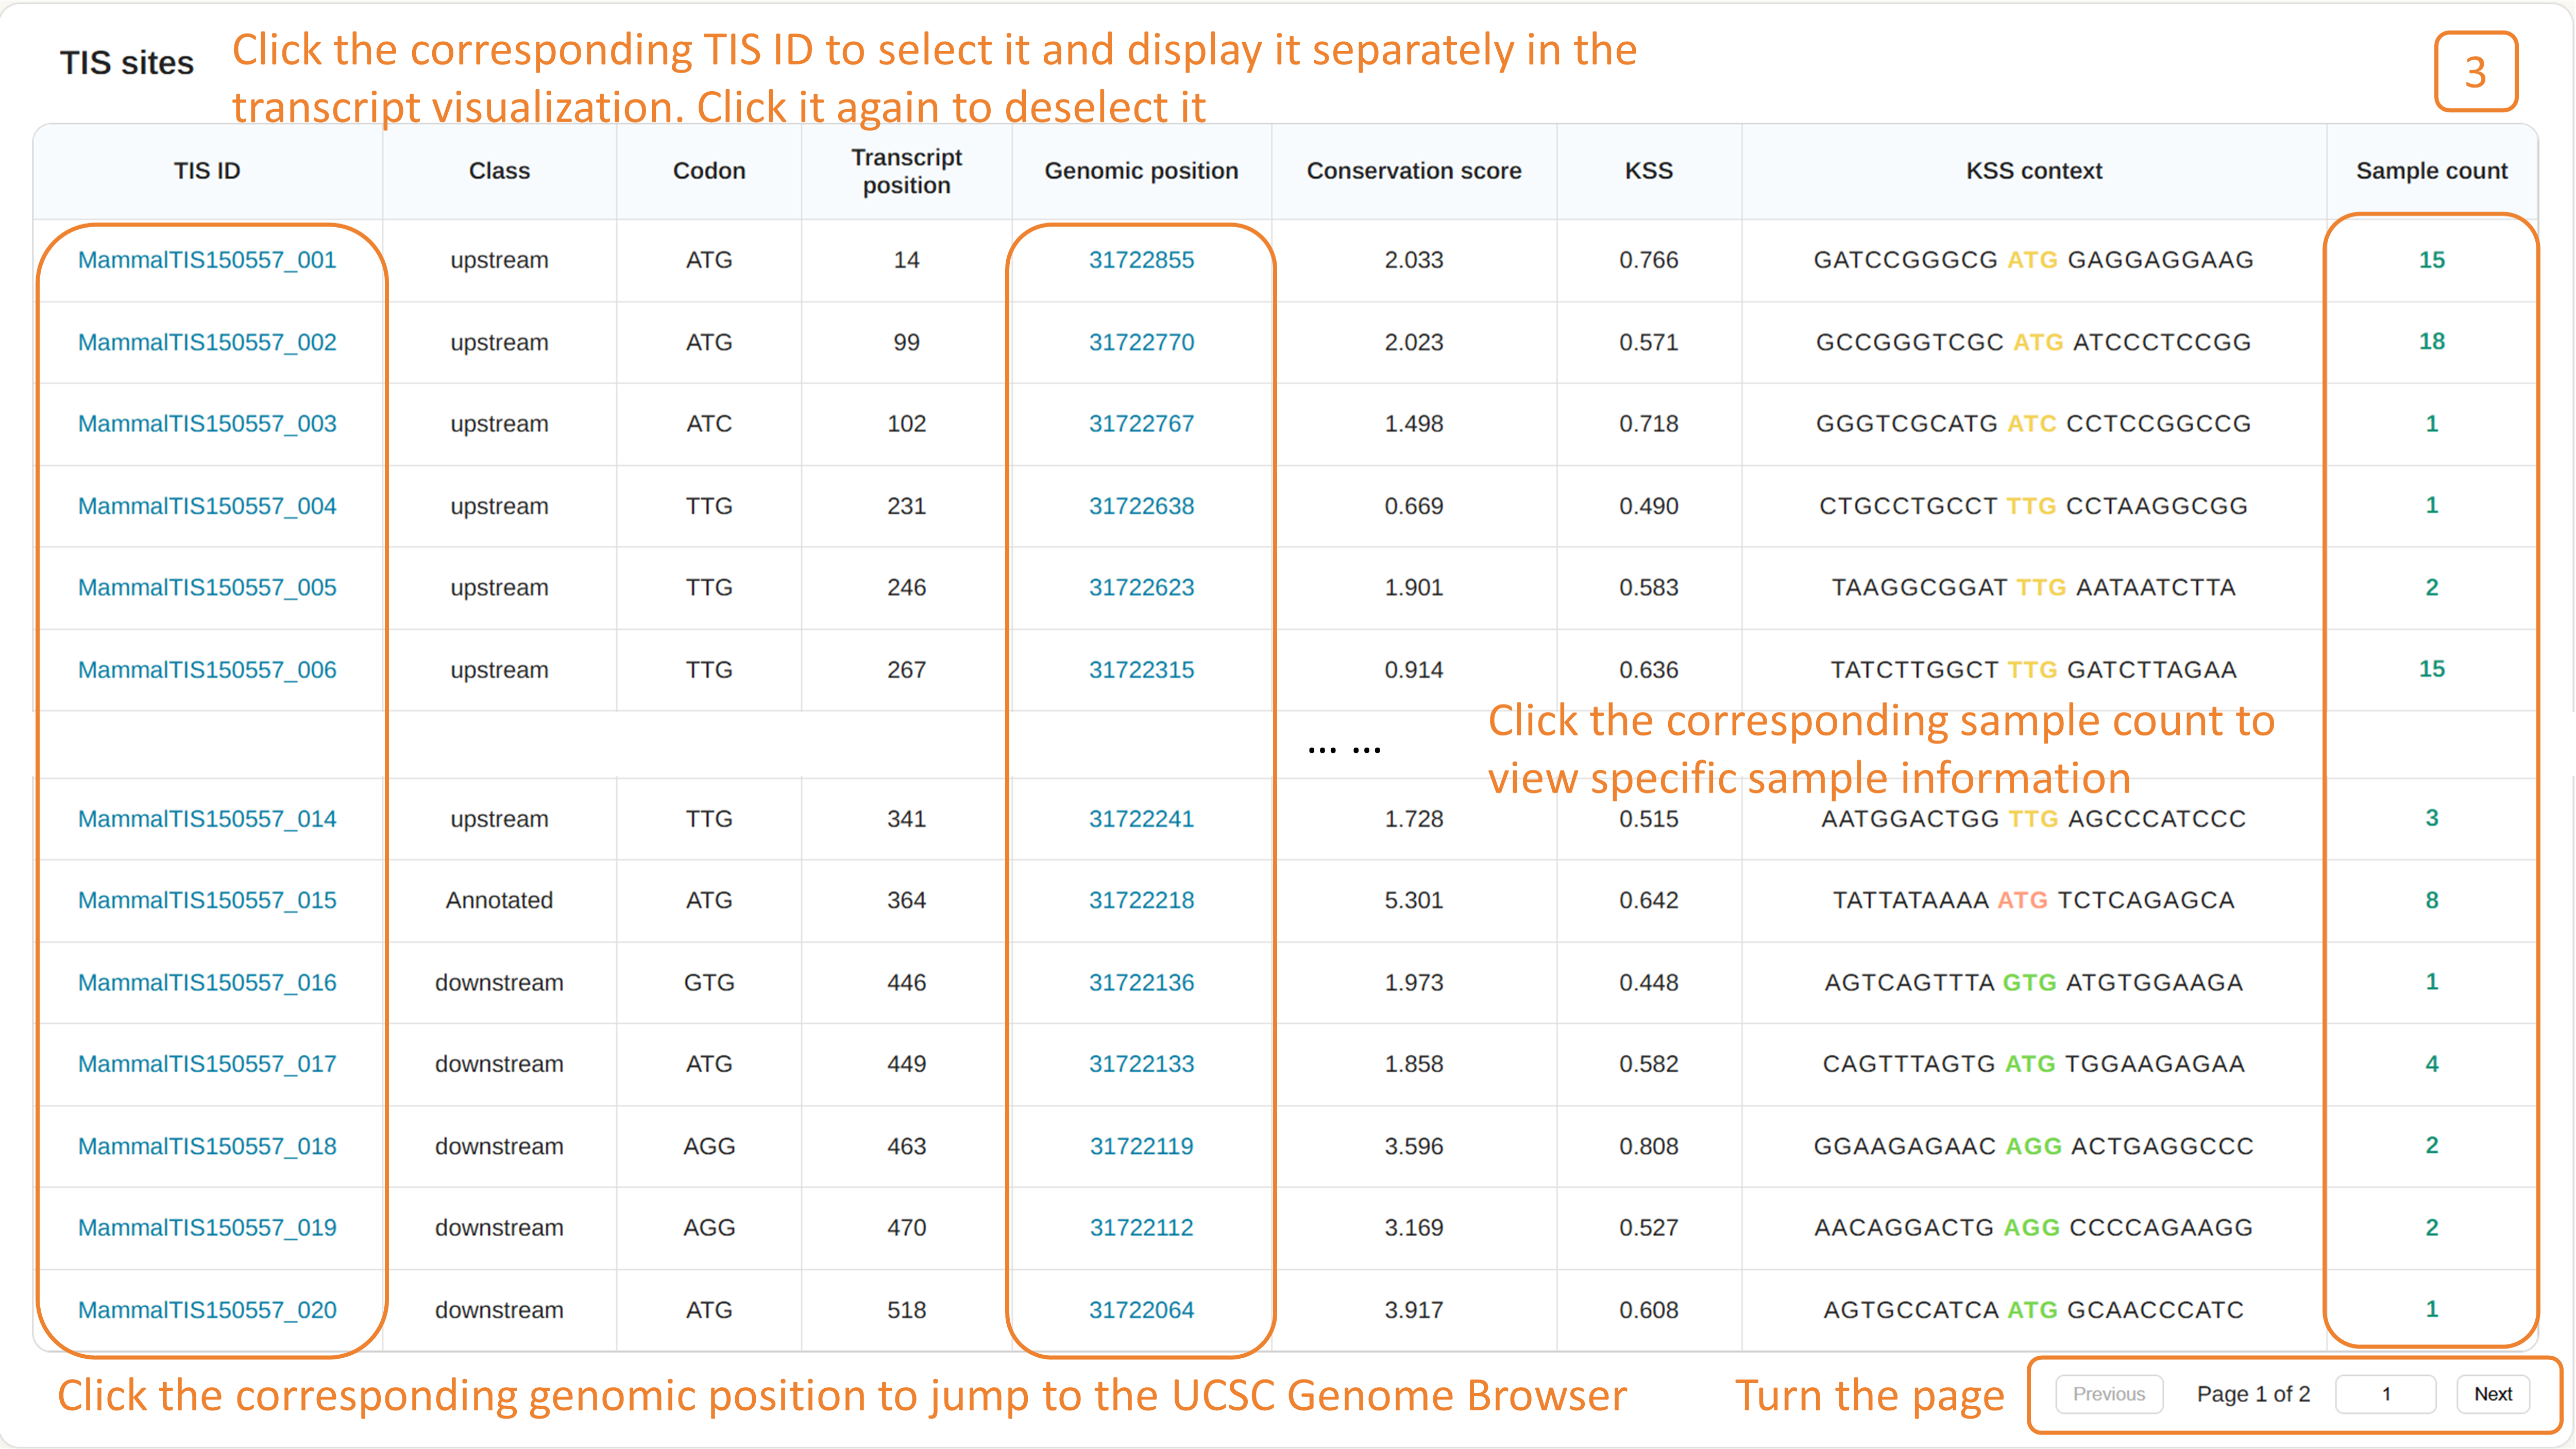
3.TIS sites
This part lists candidate TISs detected in the selected transcript. Users can click a TIS ID to select the corresponding site and display it separately in the transcript visualization. Users can also click the genomic position to jump to the UCSC Genome Browser. The sample count column summarizes the number of supporting samples for each TIS; clicking the sample count opens the detailed supported-sample table. Pagination controls are provided at the bottom of the table.
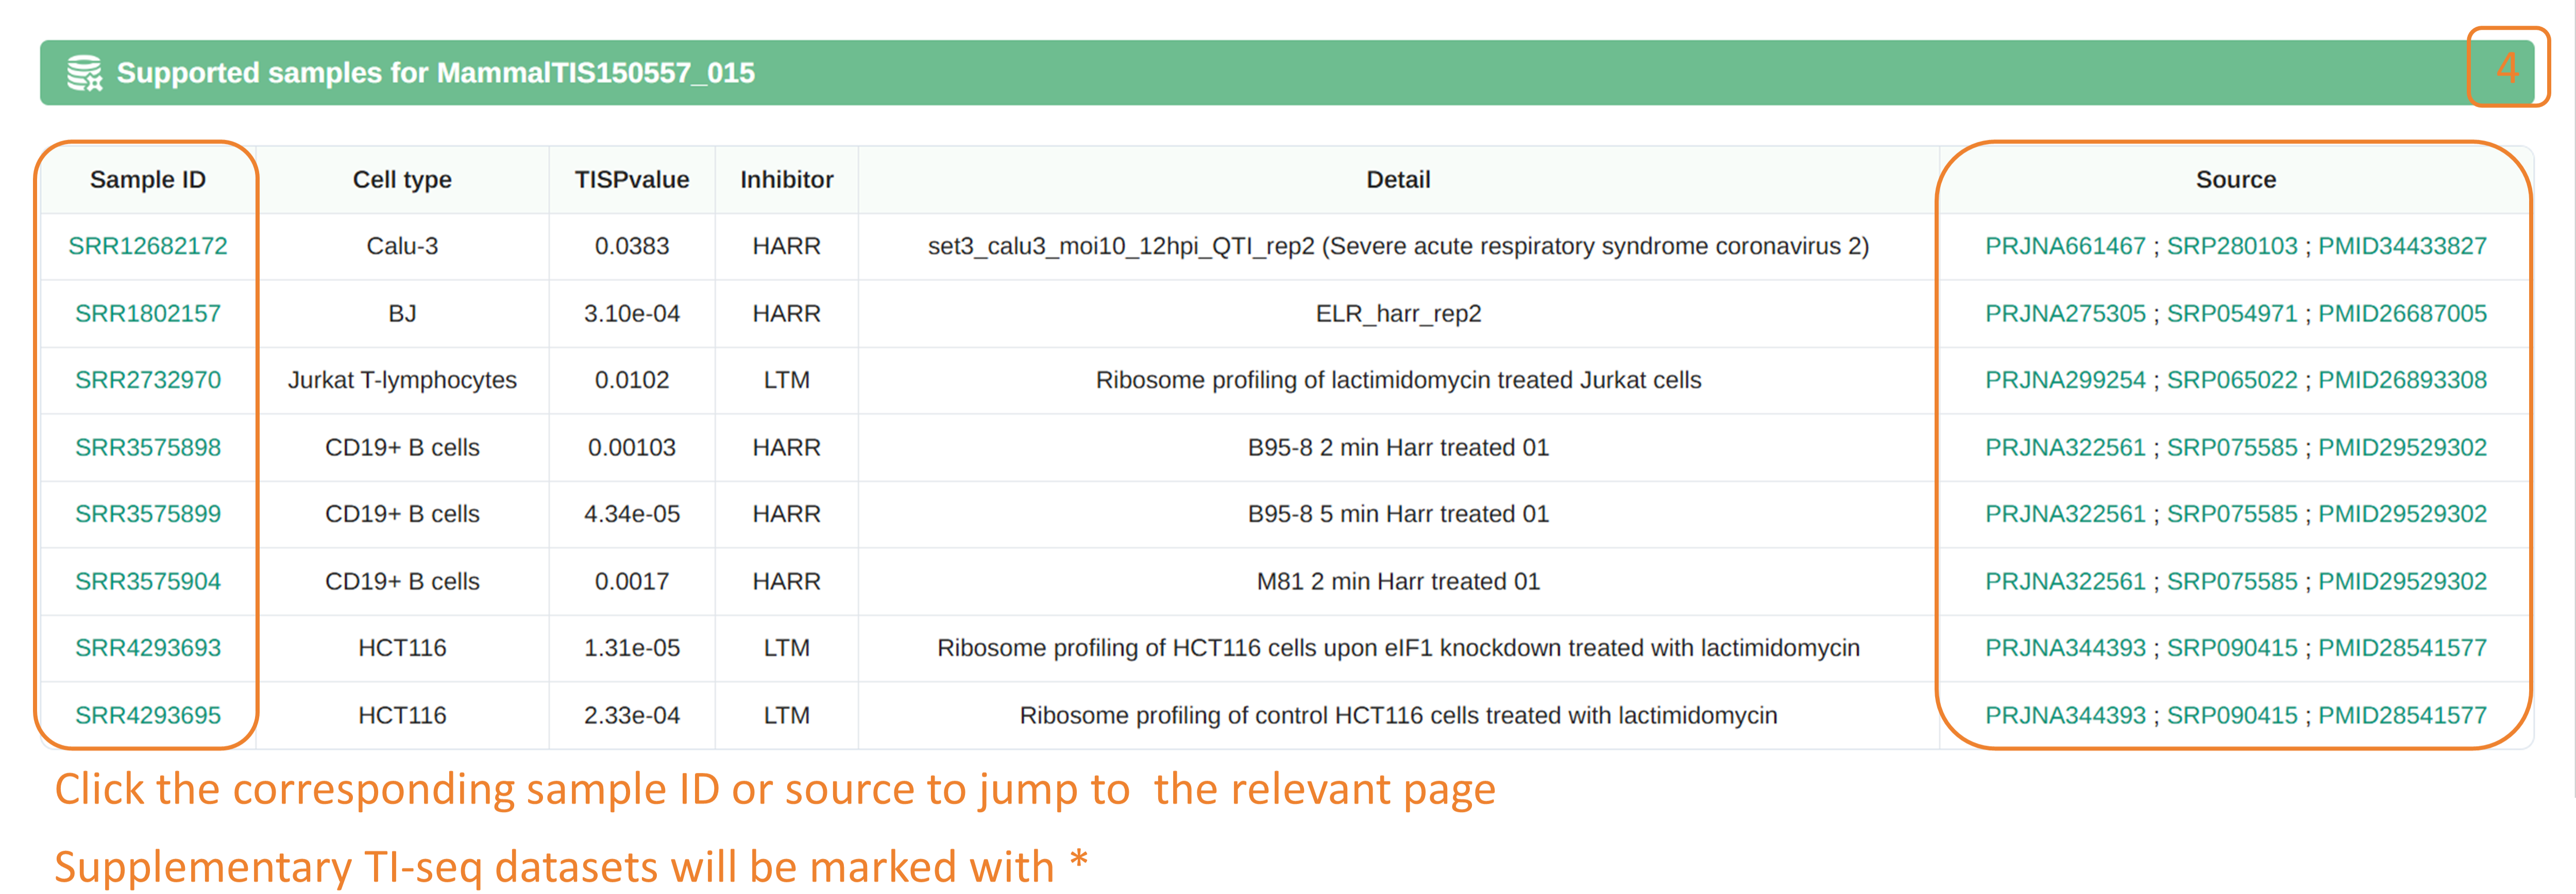
4.Supported samples
This part shows the detailed sample evidence supporting a selected TIS. The supported-sample table includes sample ID, cell type, inhibitor, experimental detail, and source information. Users can click a sample ID or source accession to open the corresponding external database page. An asterisk after a sample ID indicates a supplementary TI-seq dataset.
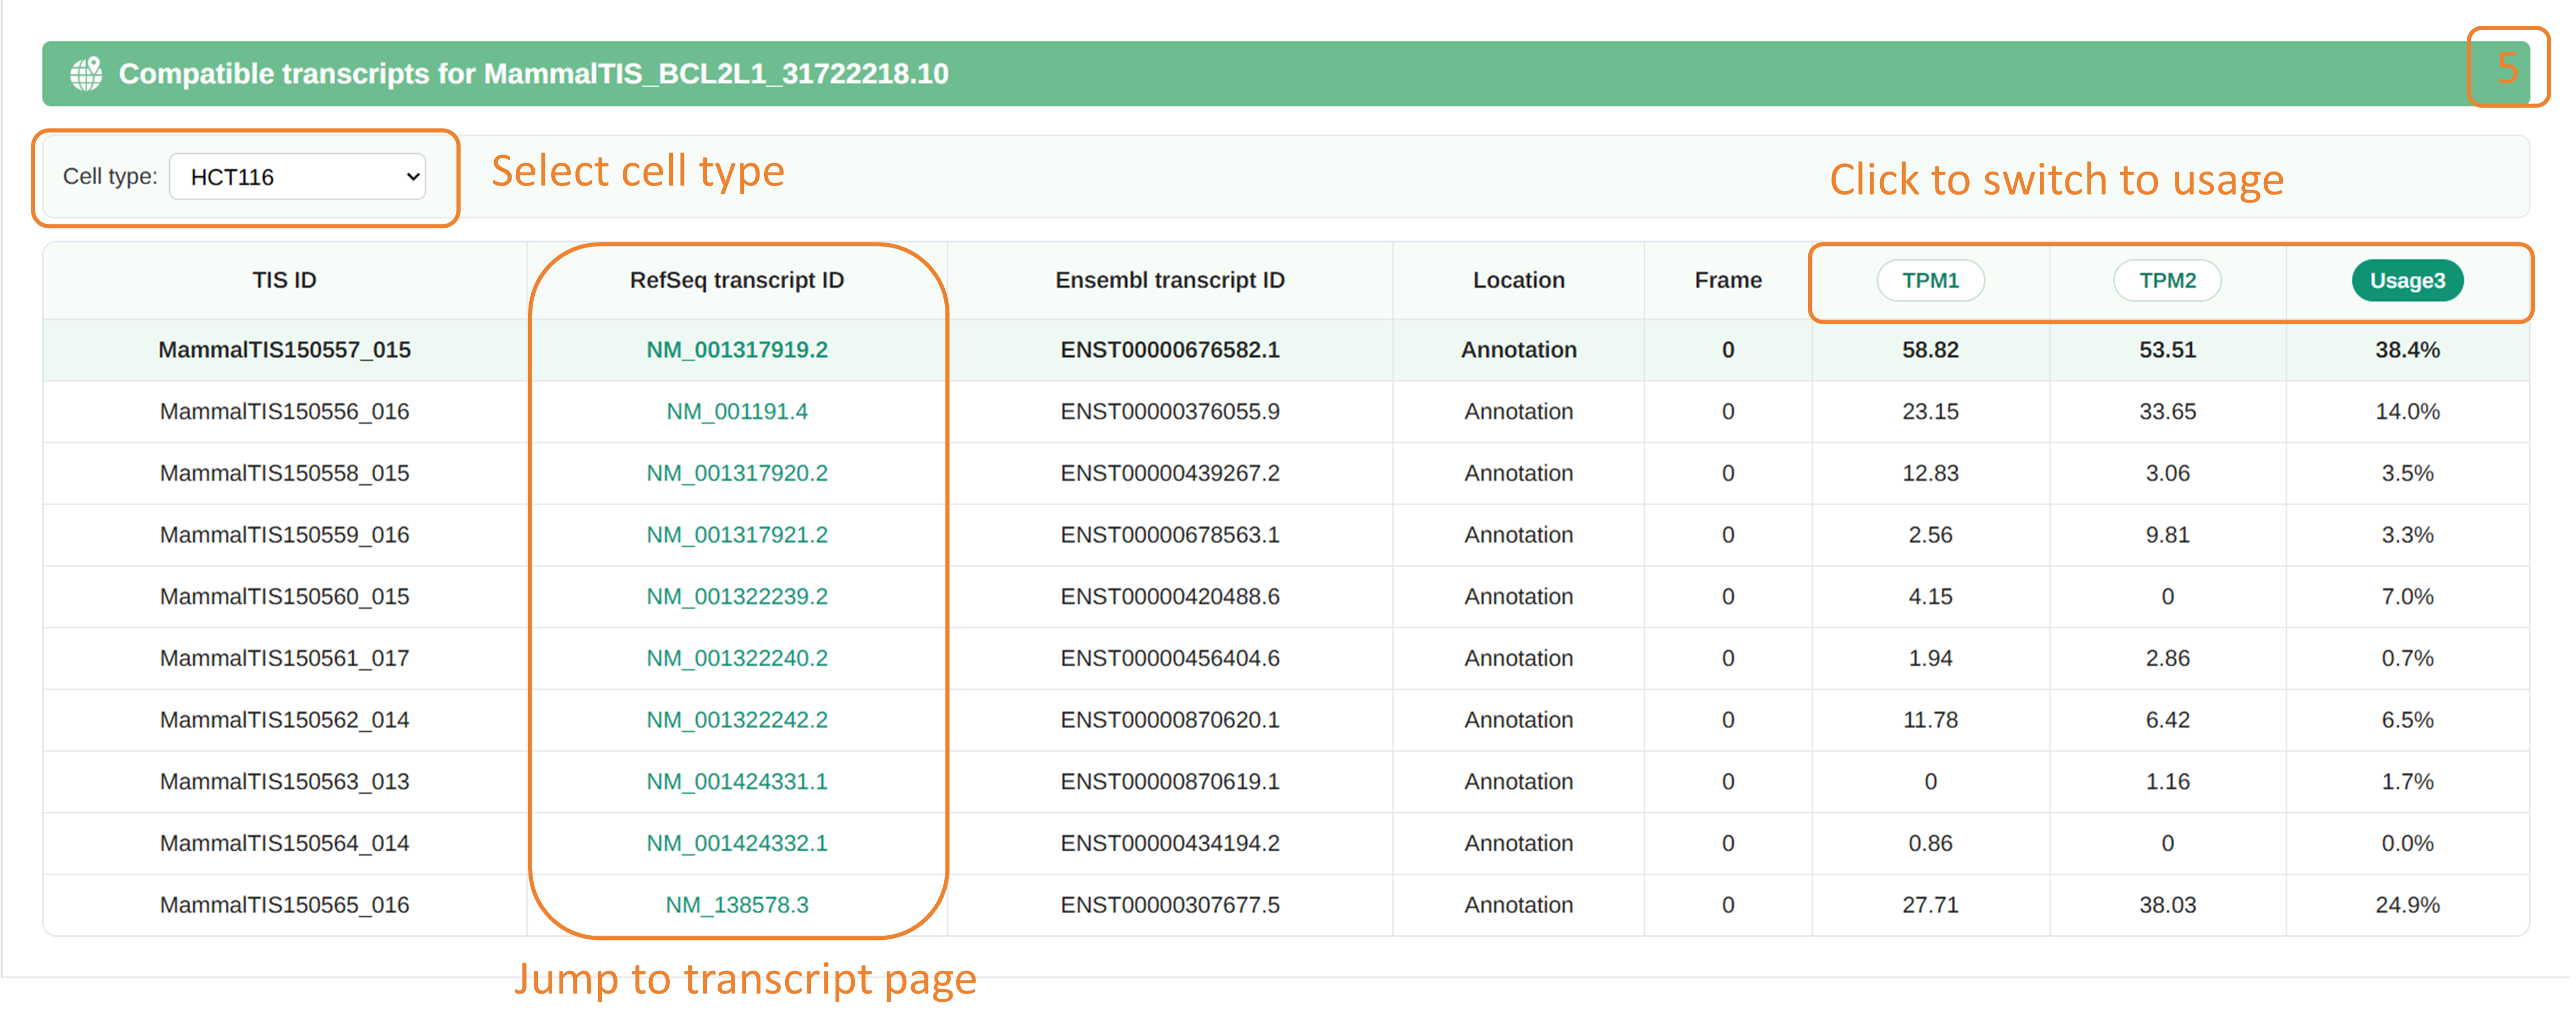
5.Compatible transcripts
This part lists all transcripts compatible with the selected TIS and shows the annotated location and reading frame of the TIS in each transcript, together with TPM values from three RNA-seq samples for the selected cell type. This information helps users assess the potential transcript assignment of the TIS in the corresponding cell type.
6.Transcript sequence
This part displays the full transcript sequence of the selected transcript.