Select image folders or videos
Upload offline microscopy batches or online monitoring videos.

Analyze images and videos with Detectron2-based instance segmentation, morphology metrics, anomaly rules, visual outputs, and downloadable reports.
Platform Workflow
MicroVision turns microscopy image folders and sampled videos into annotated outputs, instance-level morphology tables, summary trends, and archived reports.
Upload offline microscopy batches or online monitoring videos.
Set confidence thresholds and output visualization preferences.
Apply class, shape, confidence, edge, and contact checks.
Review visual predictions, trends, metrics, and downloadable archives.
Detect and segment crystals, droplets, microspheres, bubbles, and aggregates.
Extract area, aspect ratio, circularity, diameter, and class-level summaries.
Apply label, shape, confidence, edge-contact, and morphology-based rules.
Run Status
About MicroVision
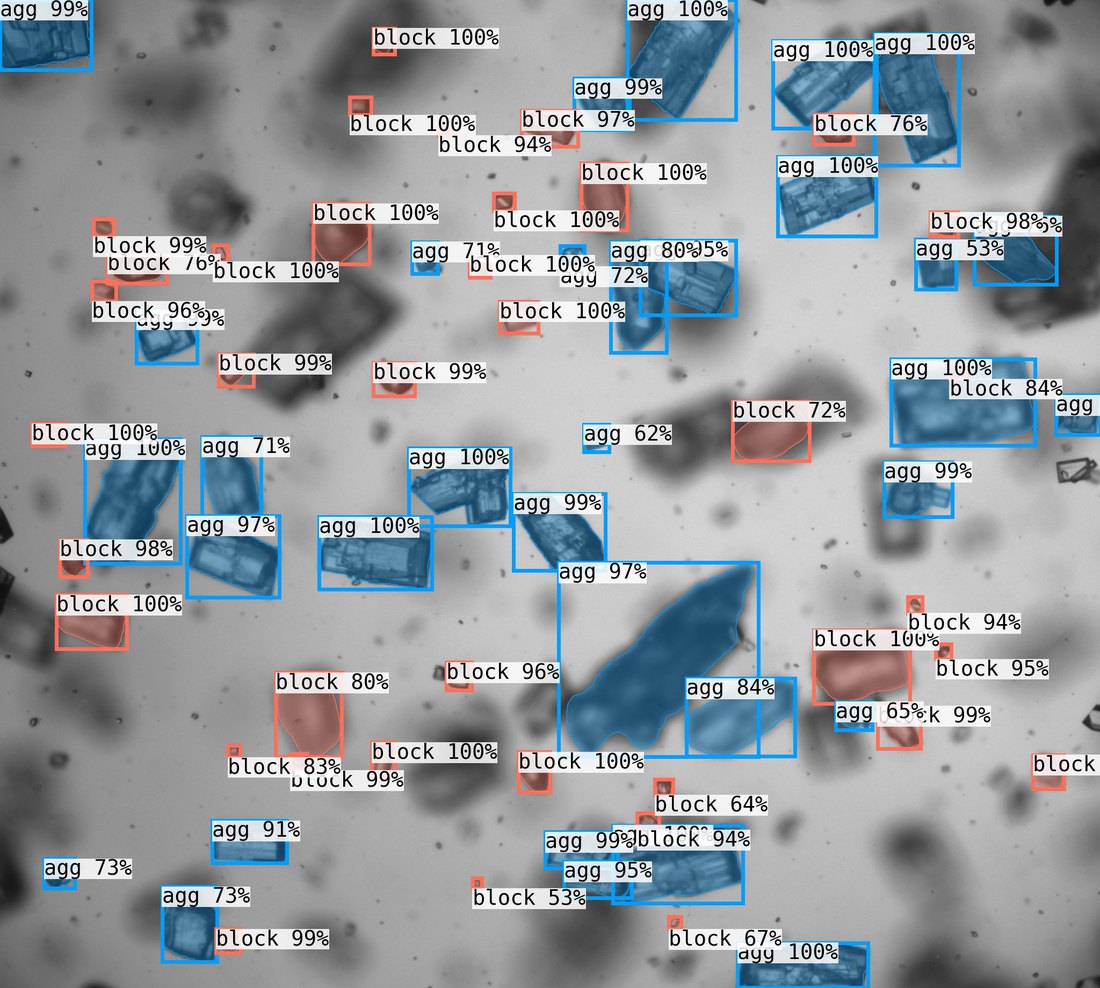
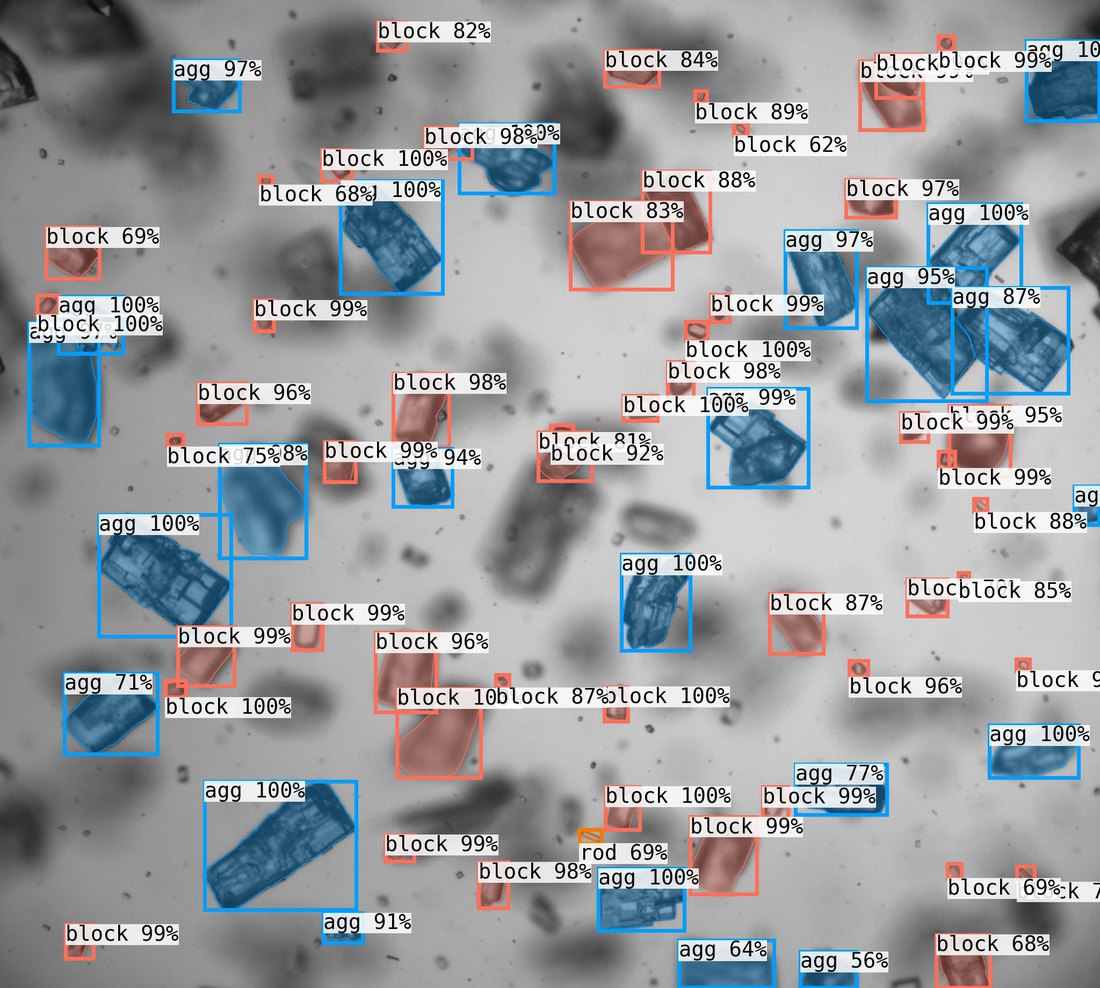
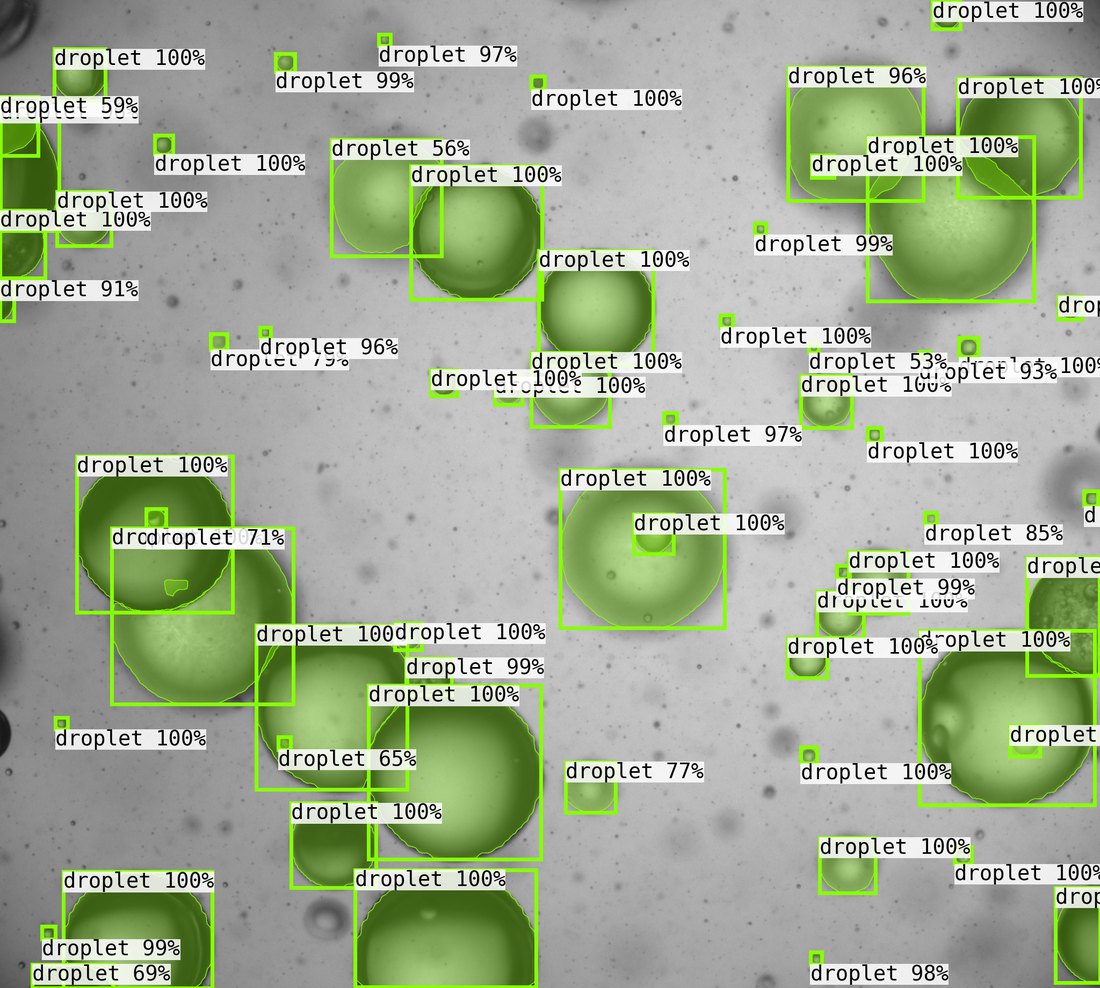
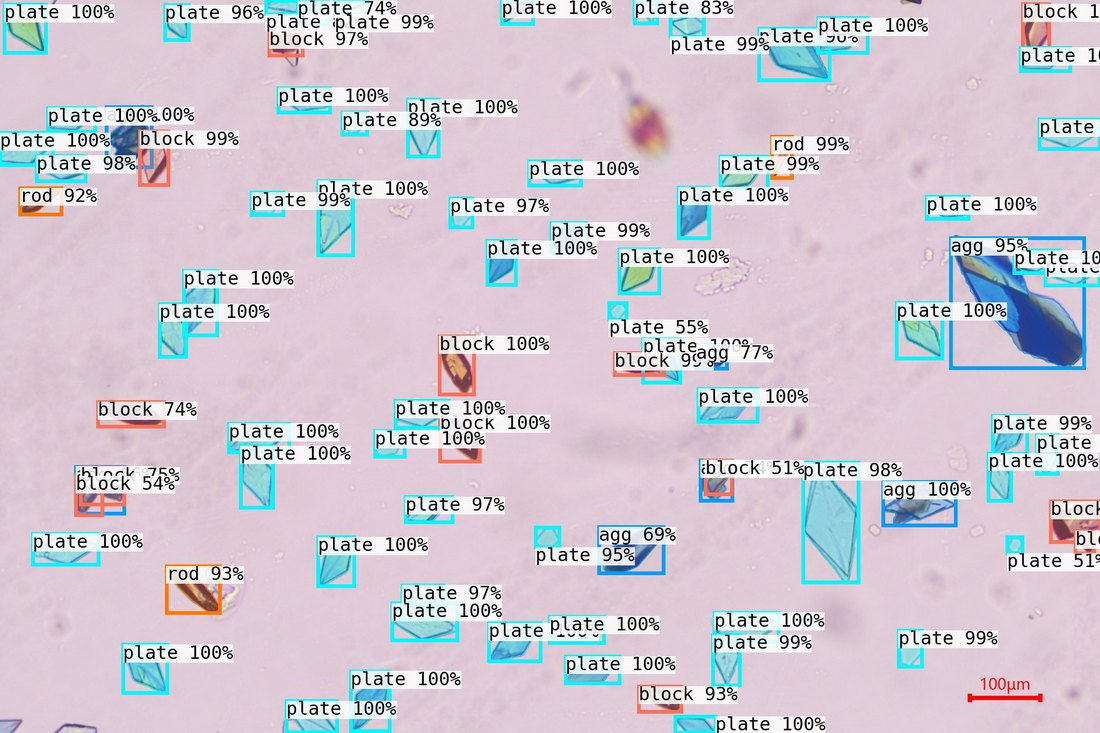
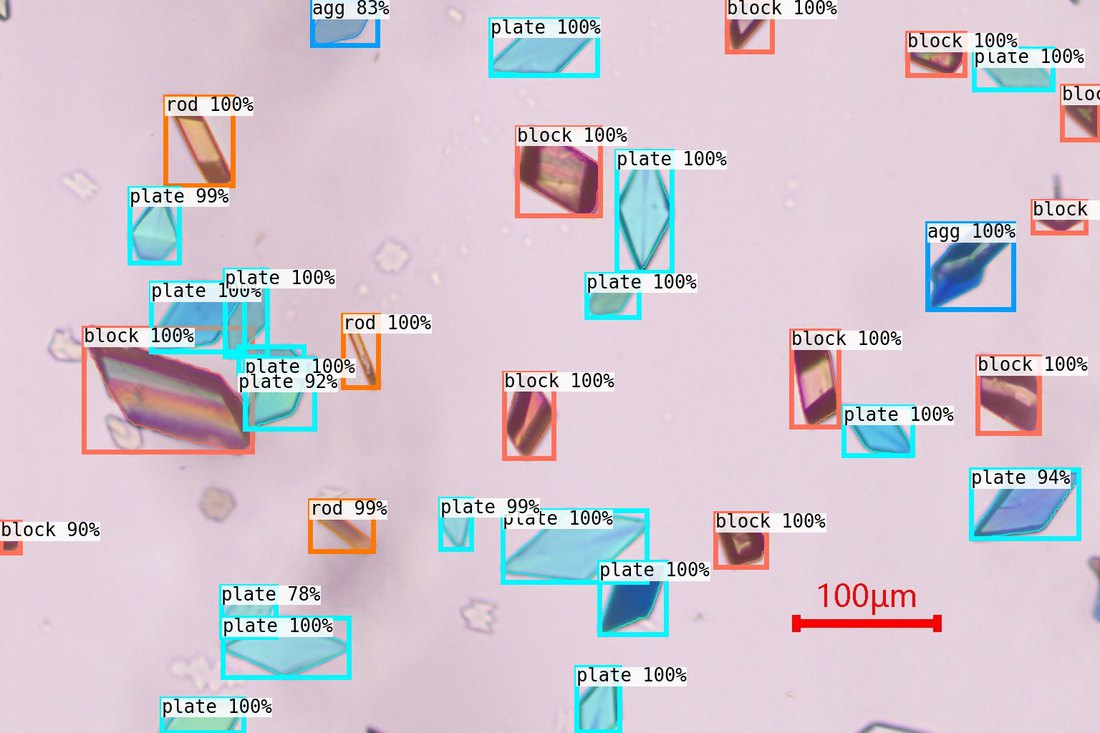
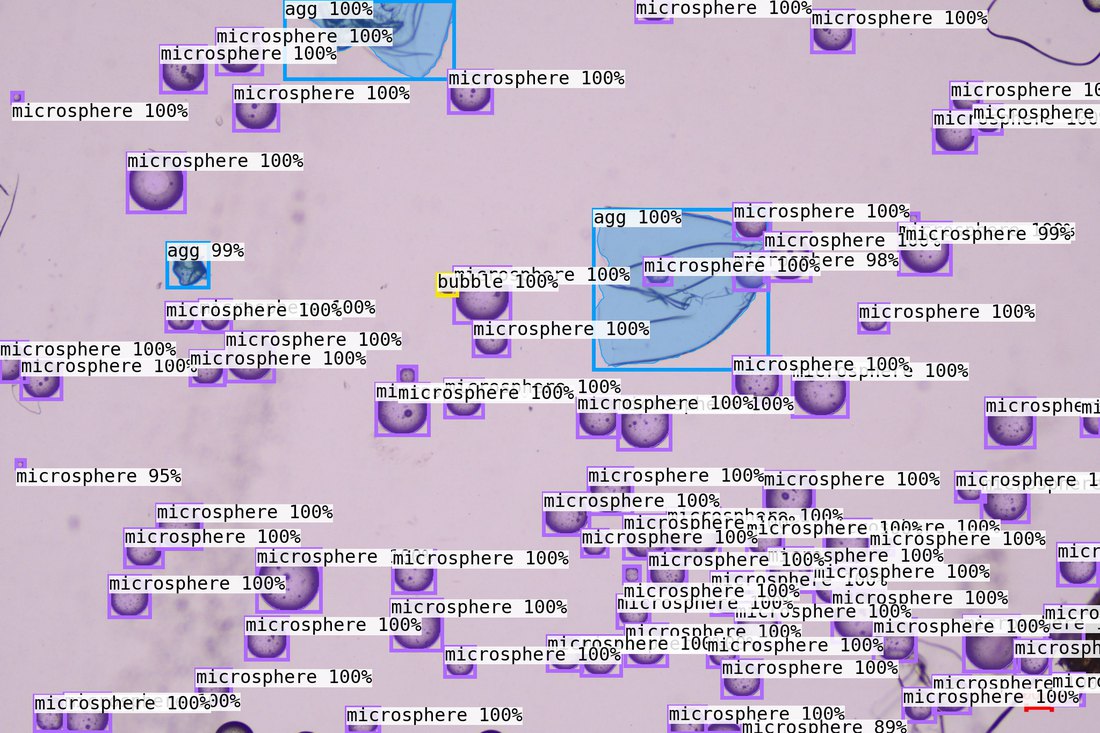
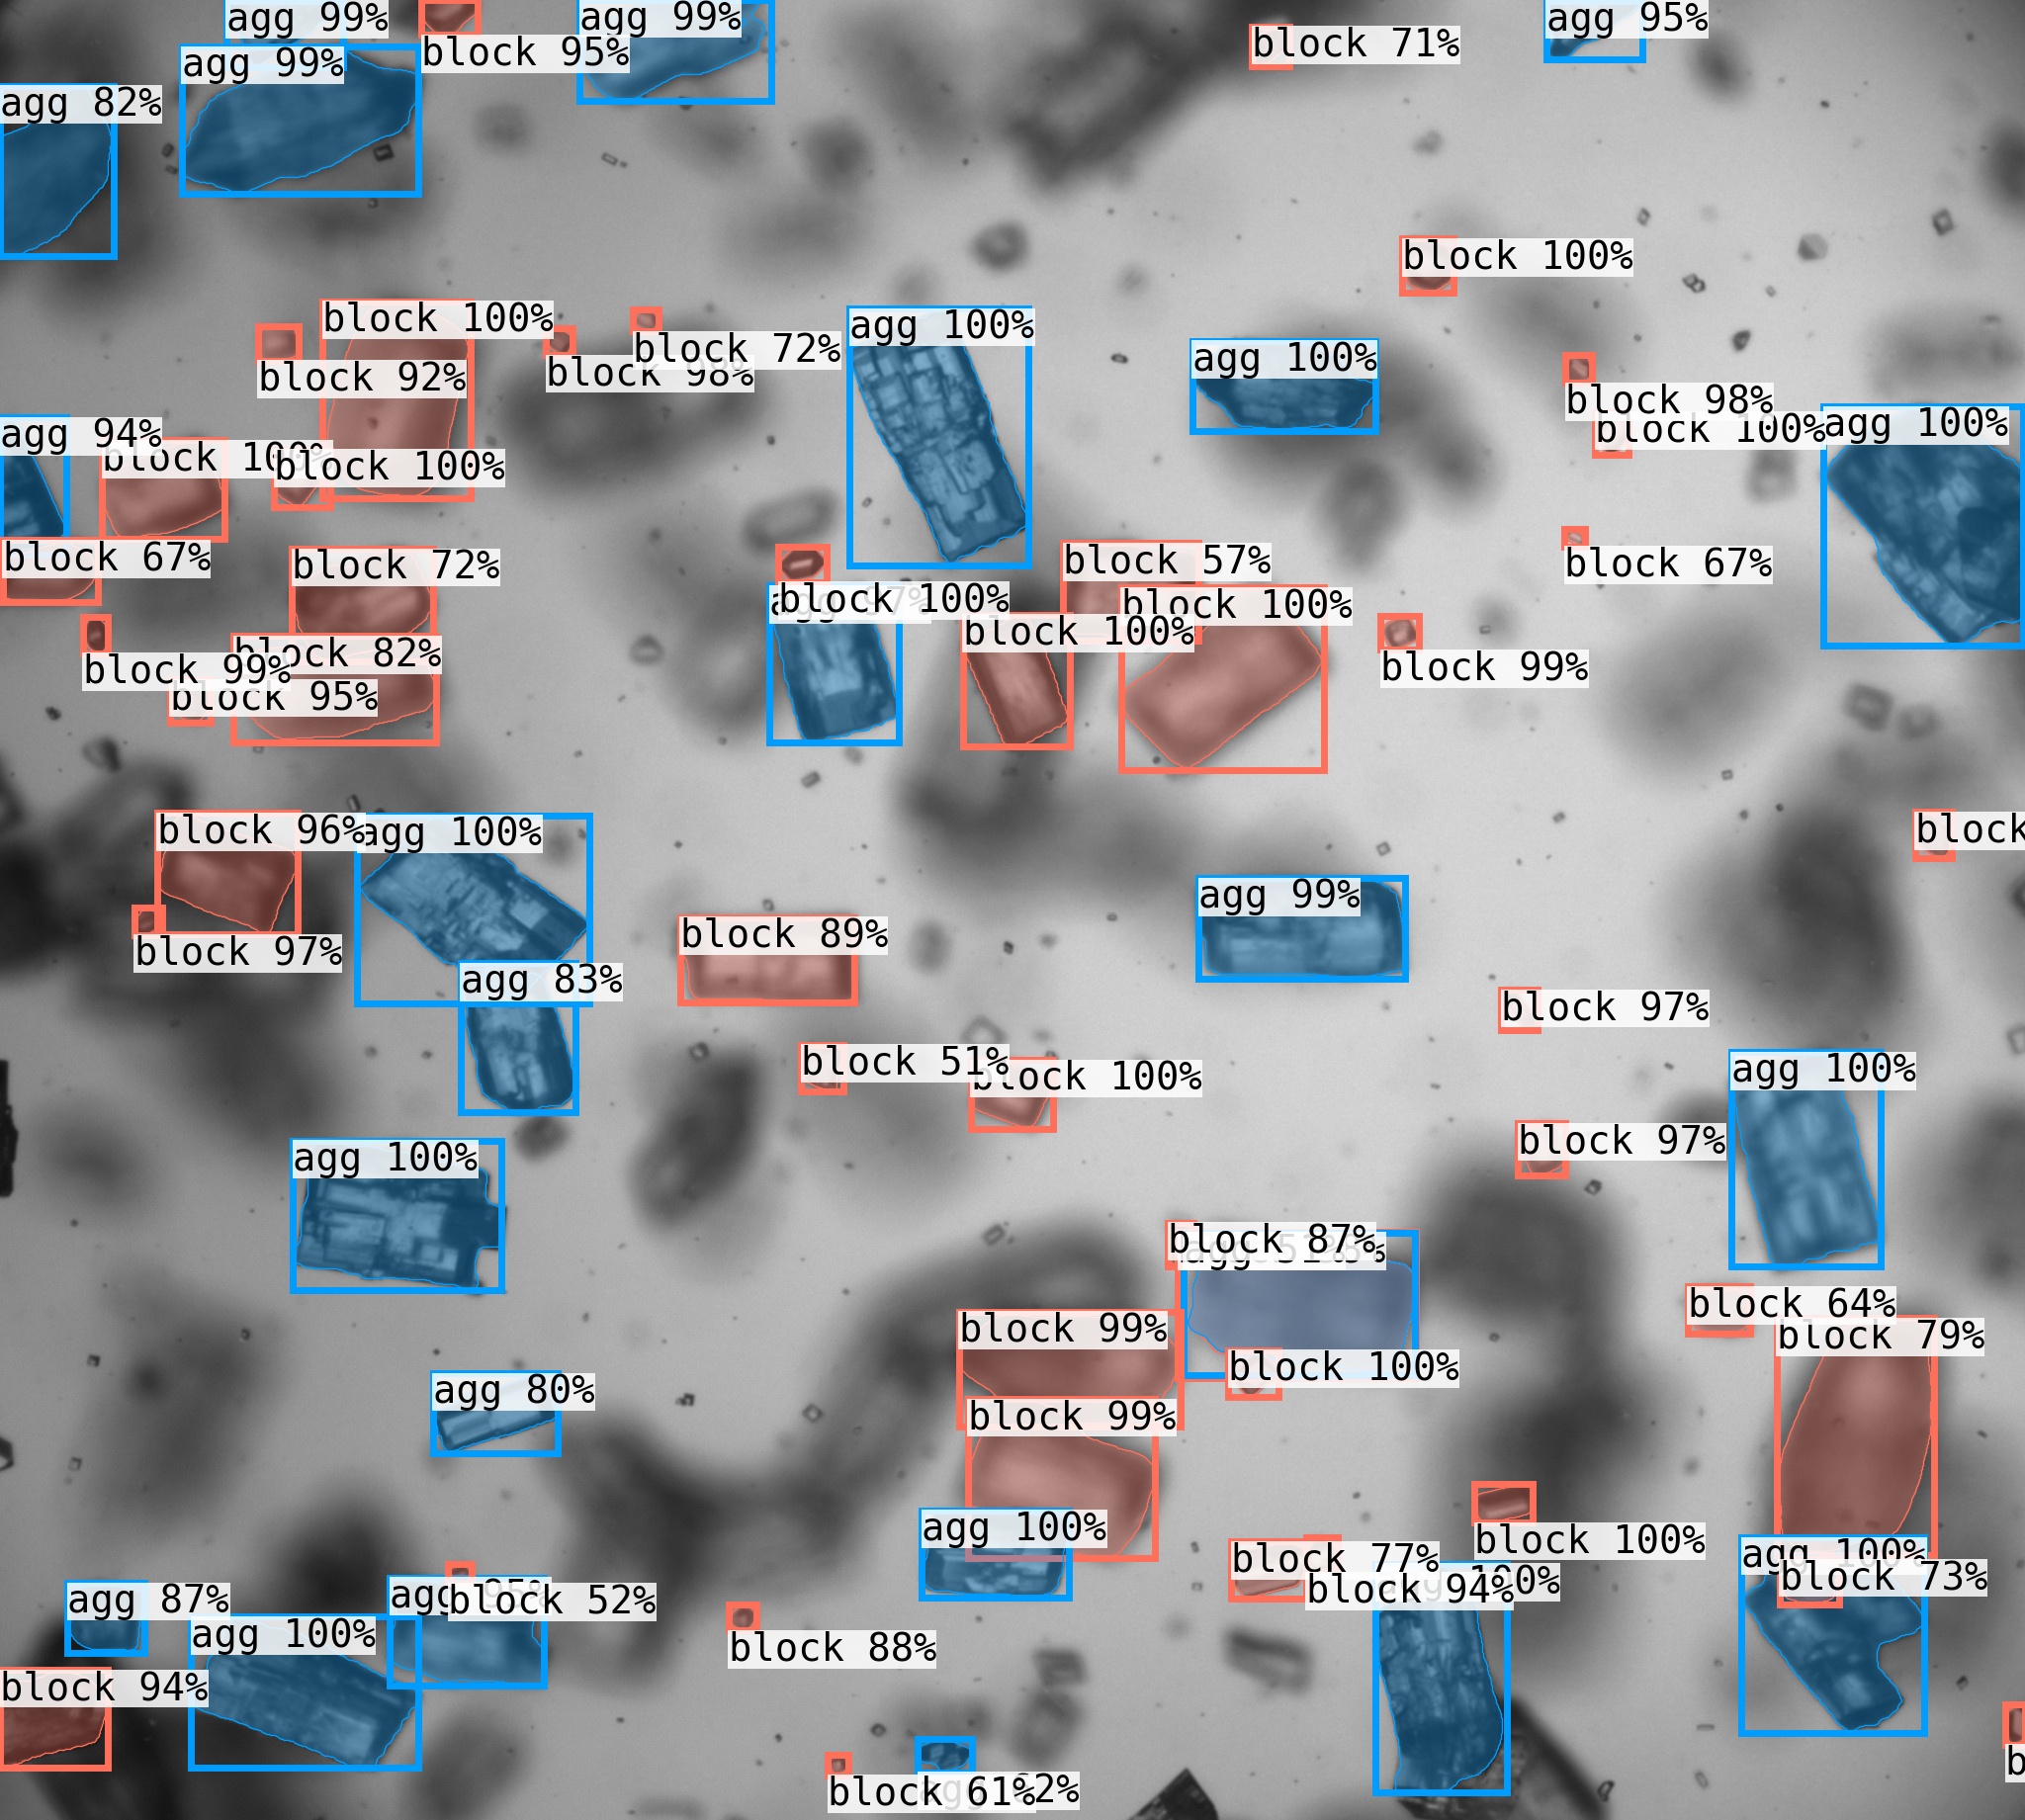
Prediction Showcase
Representative outputs from the deployed Detectron2 model on online and offline MicroBench-style images.
Scientific Foundation
MicroVision is supported by a complete workflow from dataset construction and morphology analysis to model benchmarking, robustness enhancement, and deployable prediction.
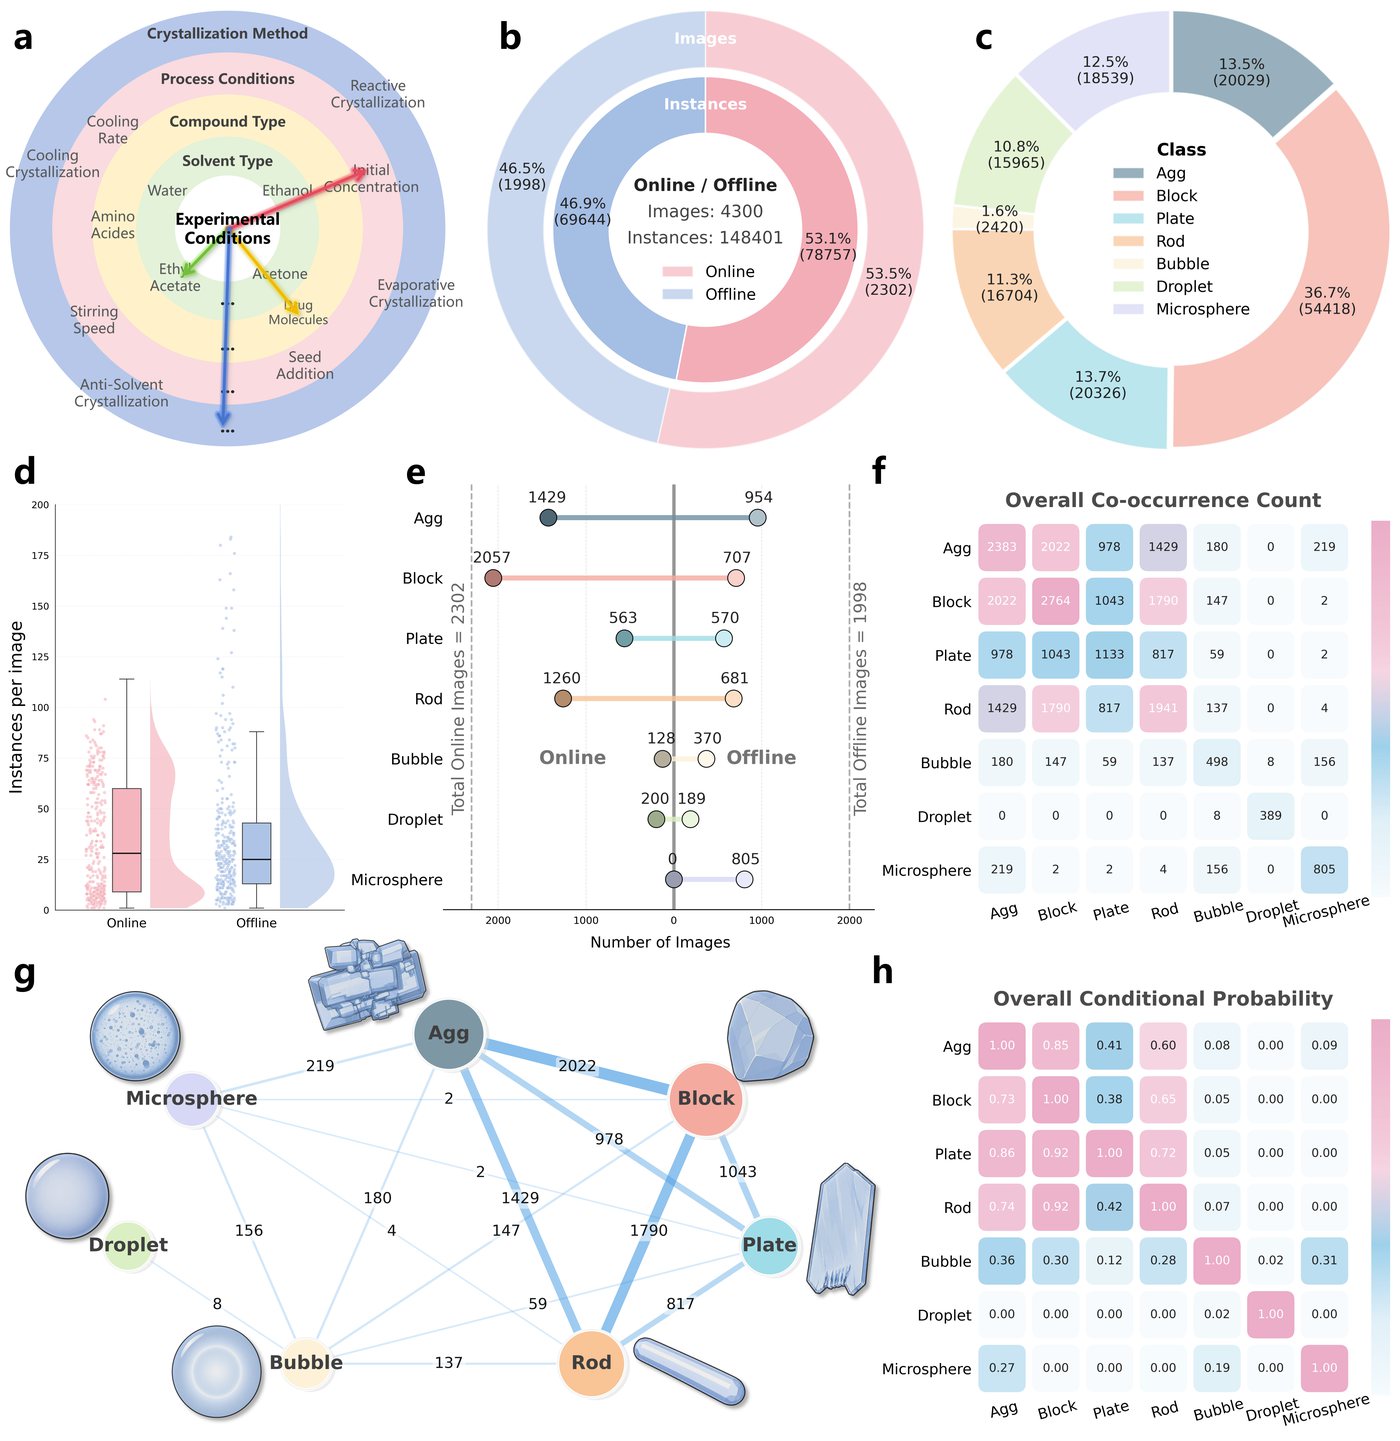
A unified instance-level dataset spanning online and offline imaging domains with particle-level annotations for deployment-oriented benchmarking.
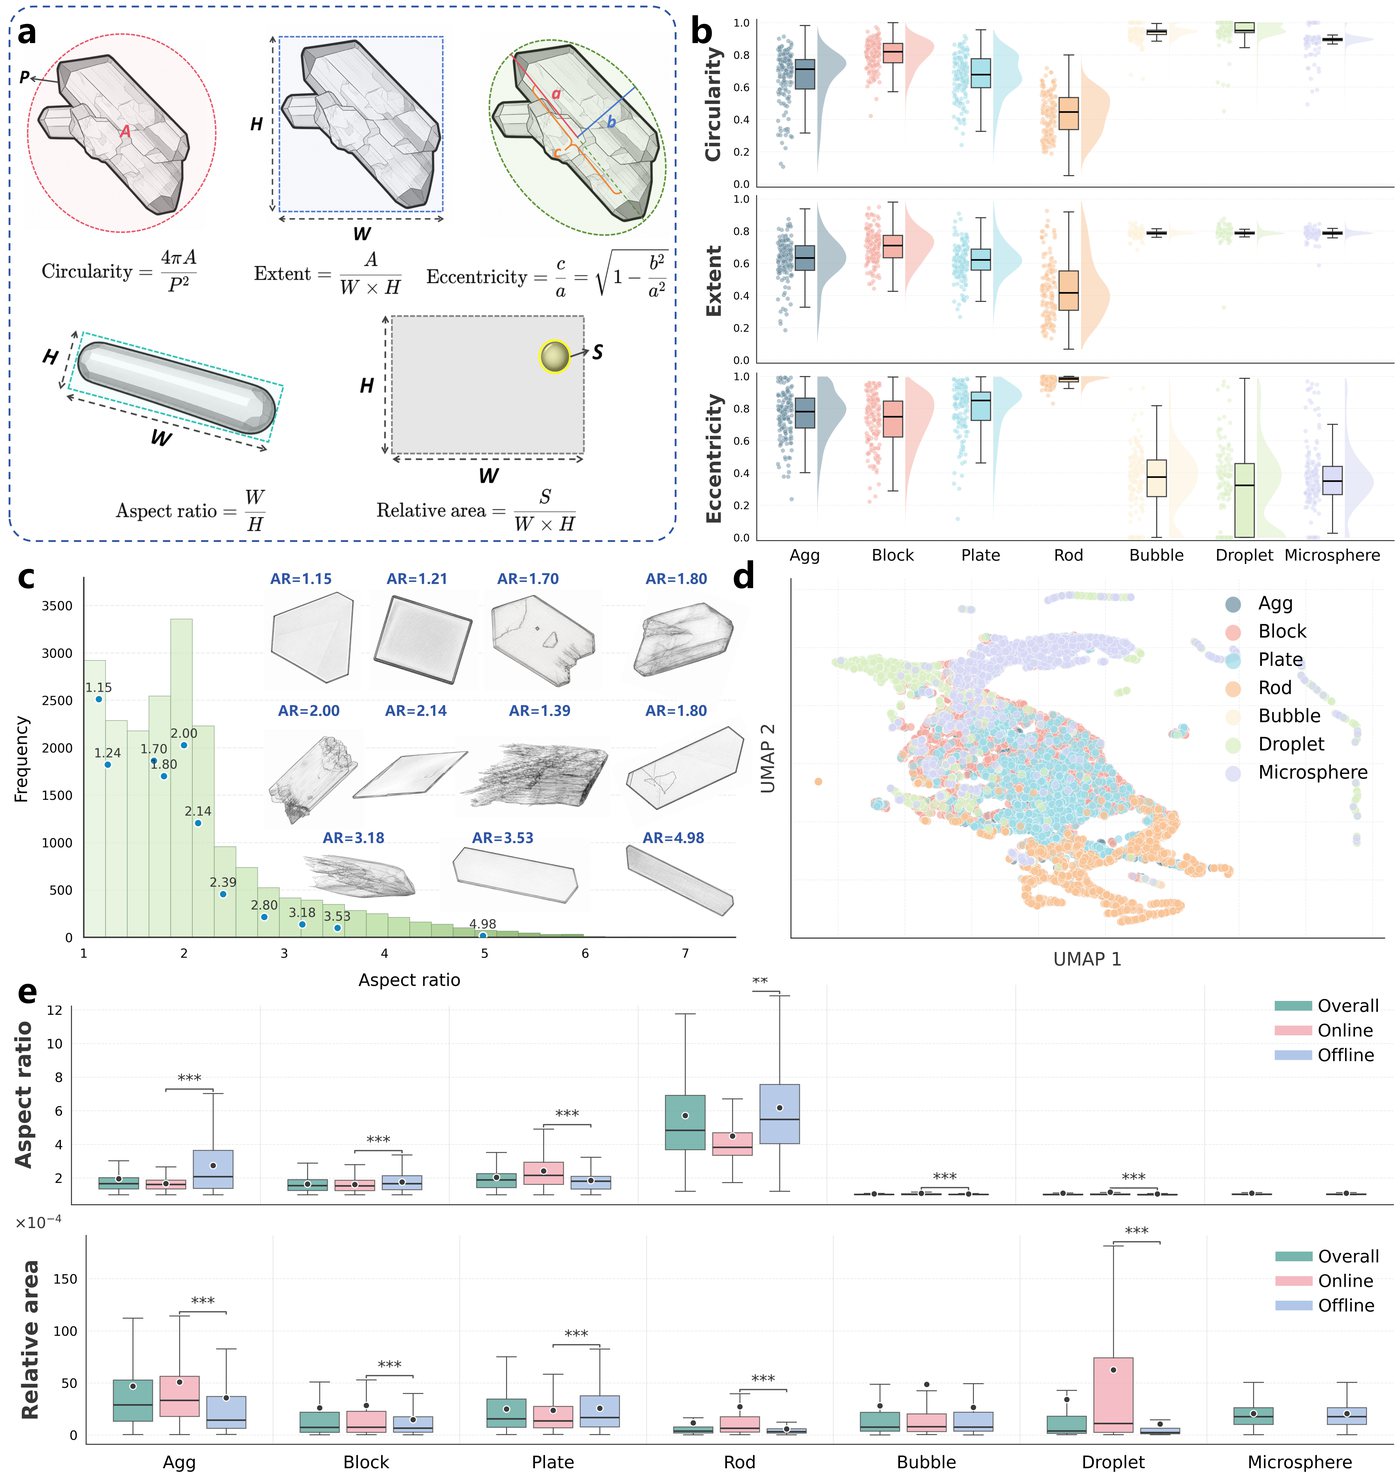
Particle morphology is characterized by circularity, extent, eccentricity, aspect ratio, and relative area.
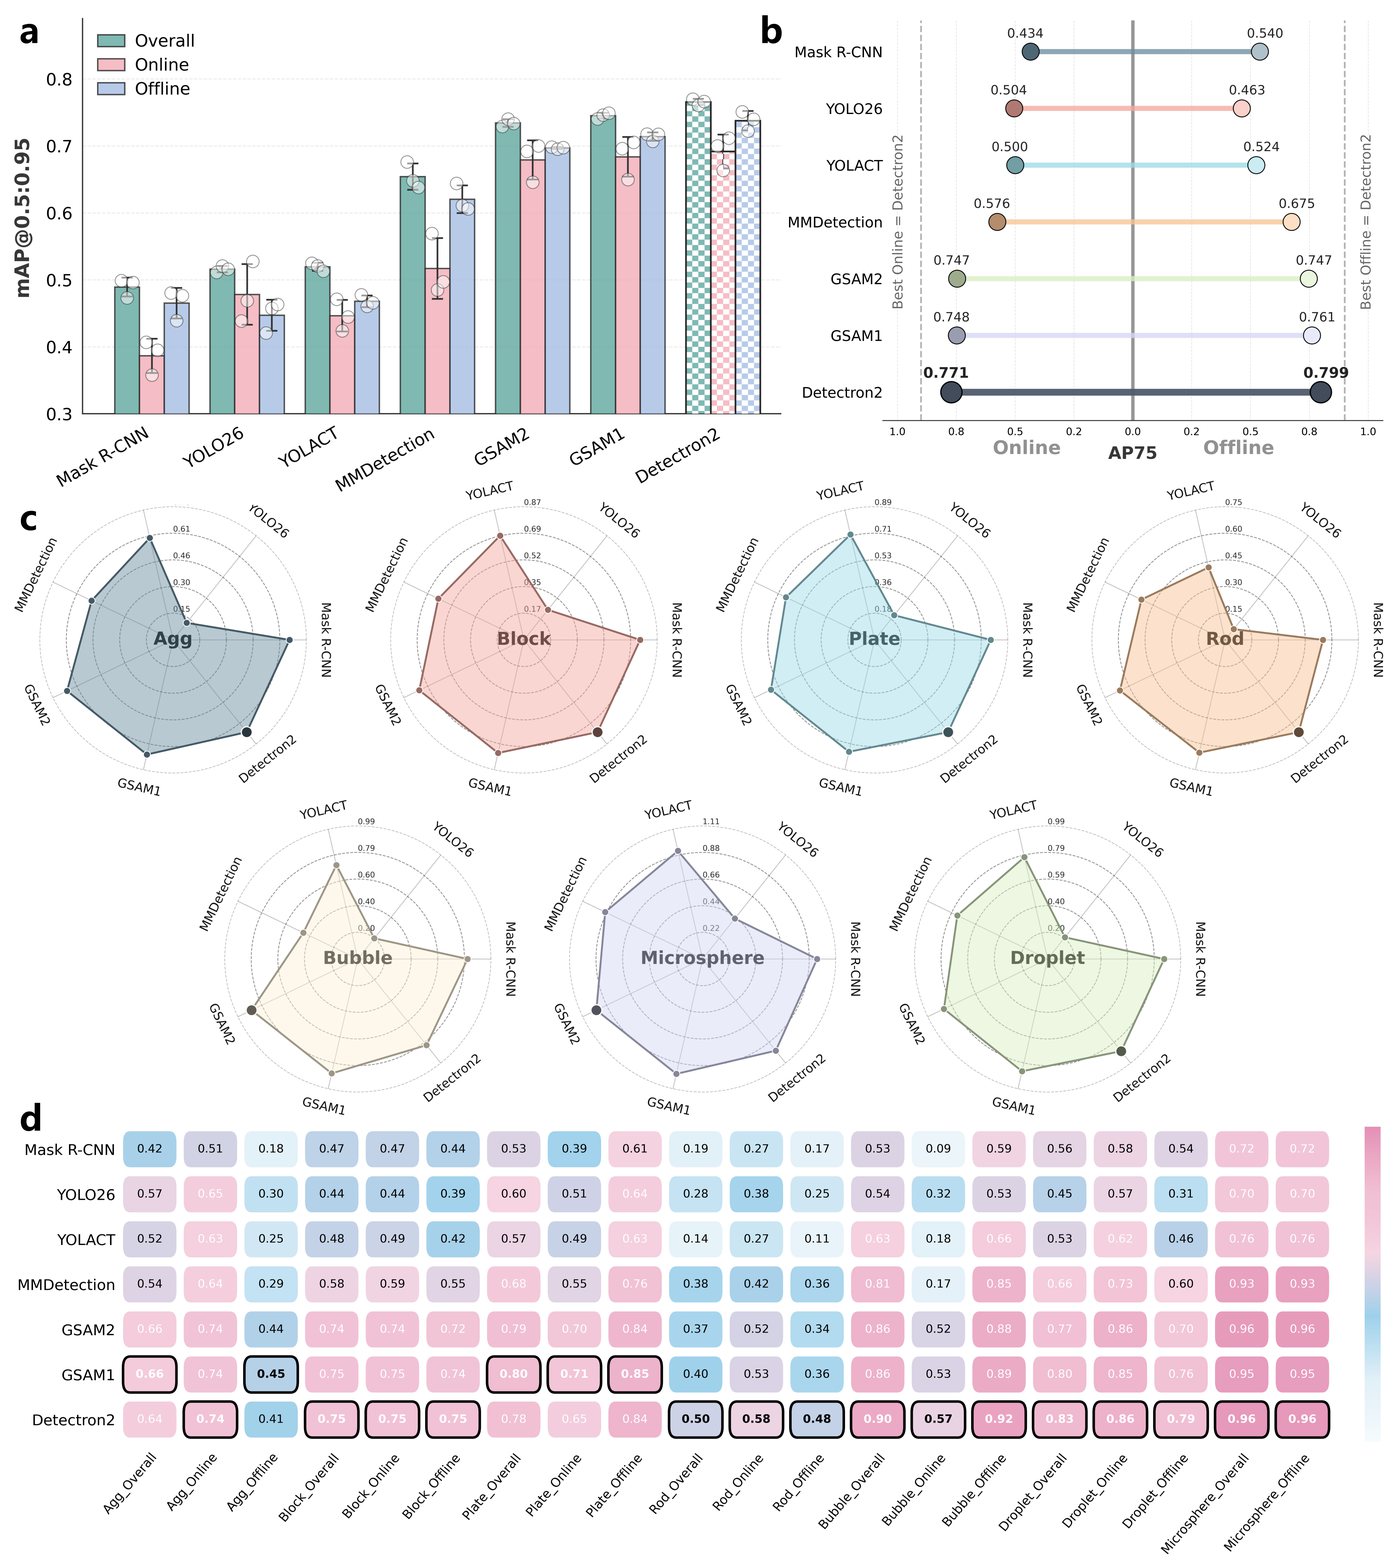
Seven segmentation systems were benchmarked under the same data splits and evaluation protocol.
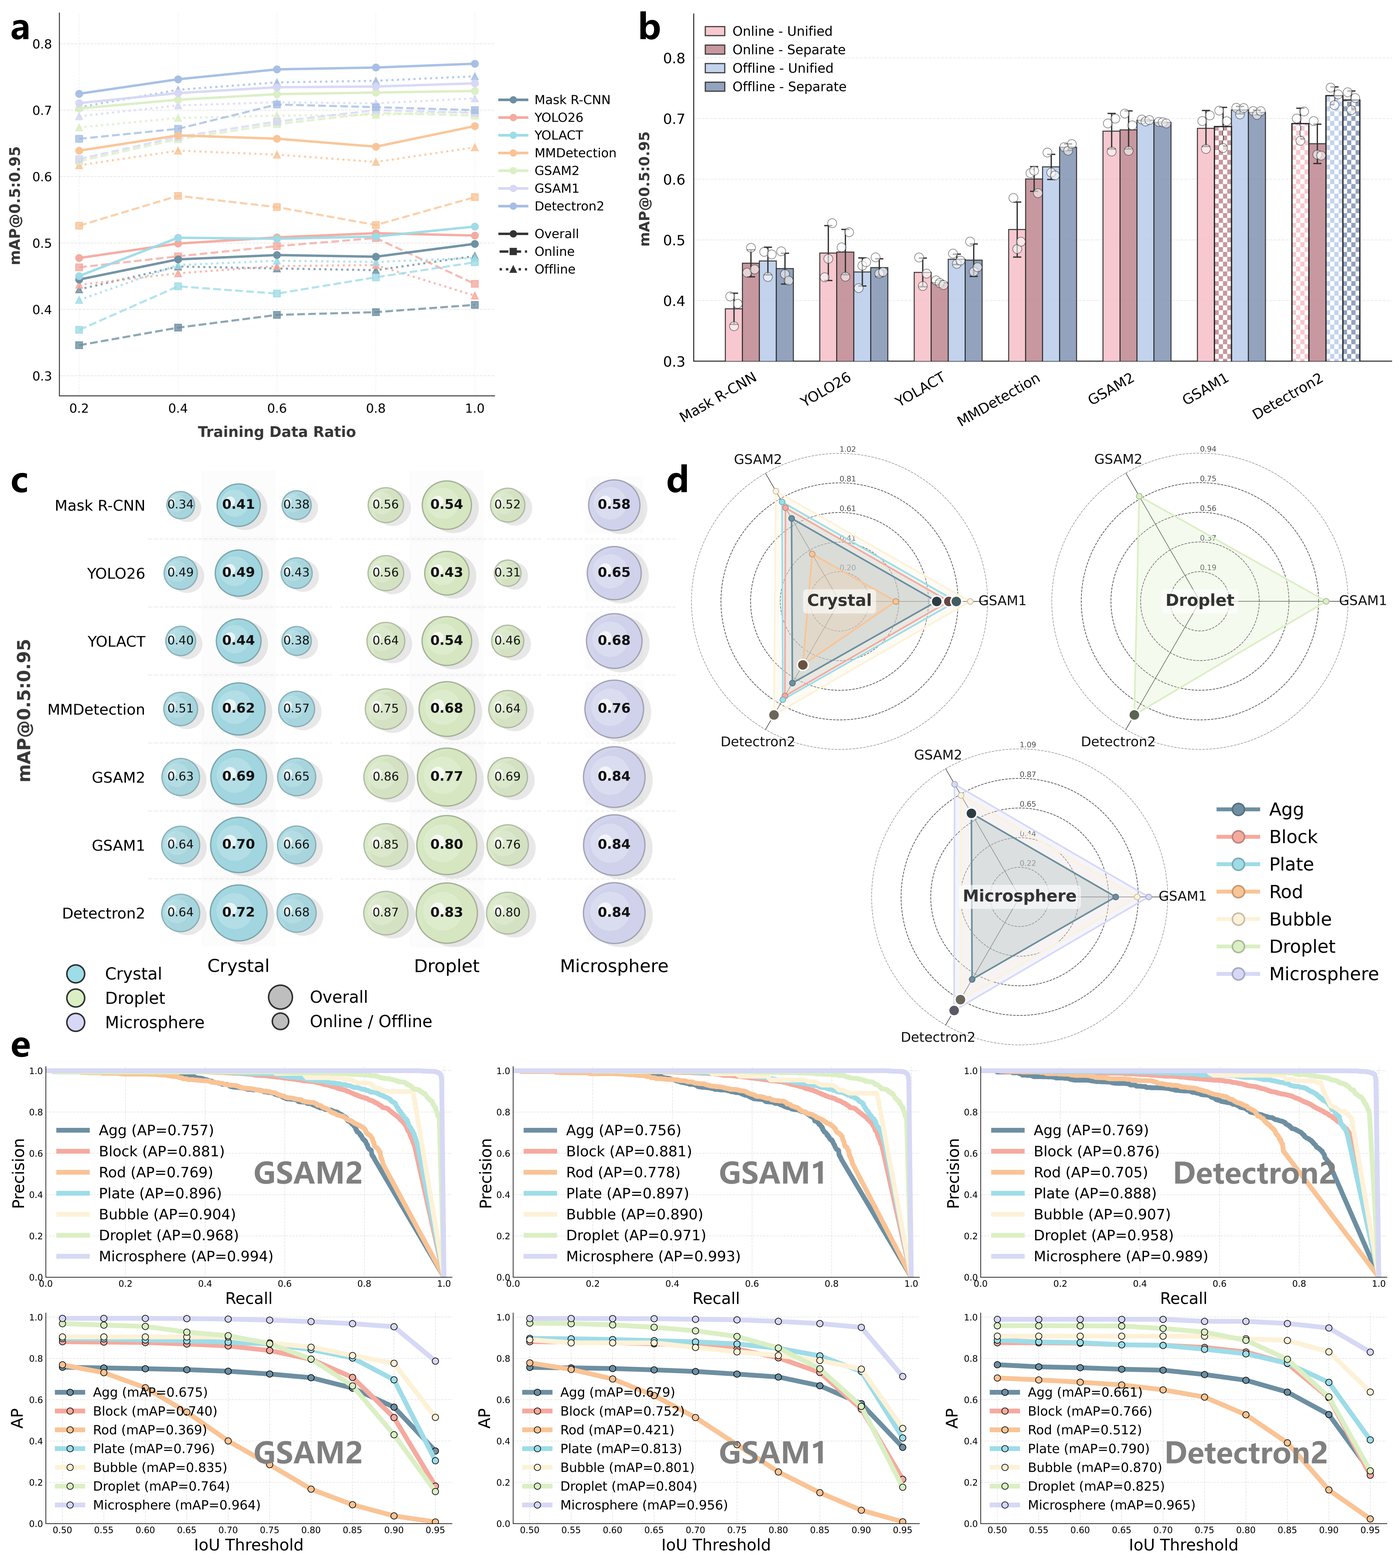
Benchmark results connect dataset composition, model behavior, and practical deployment choices.
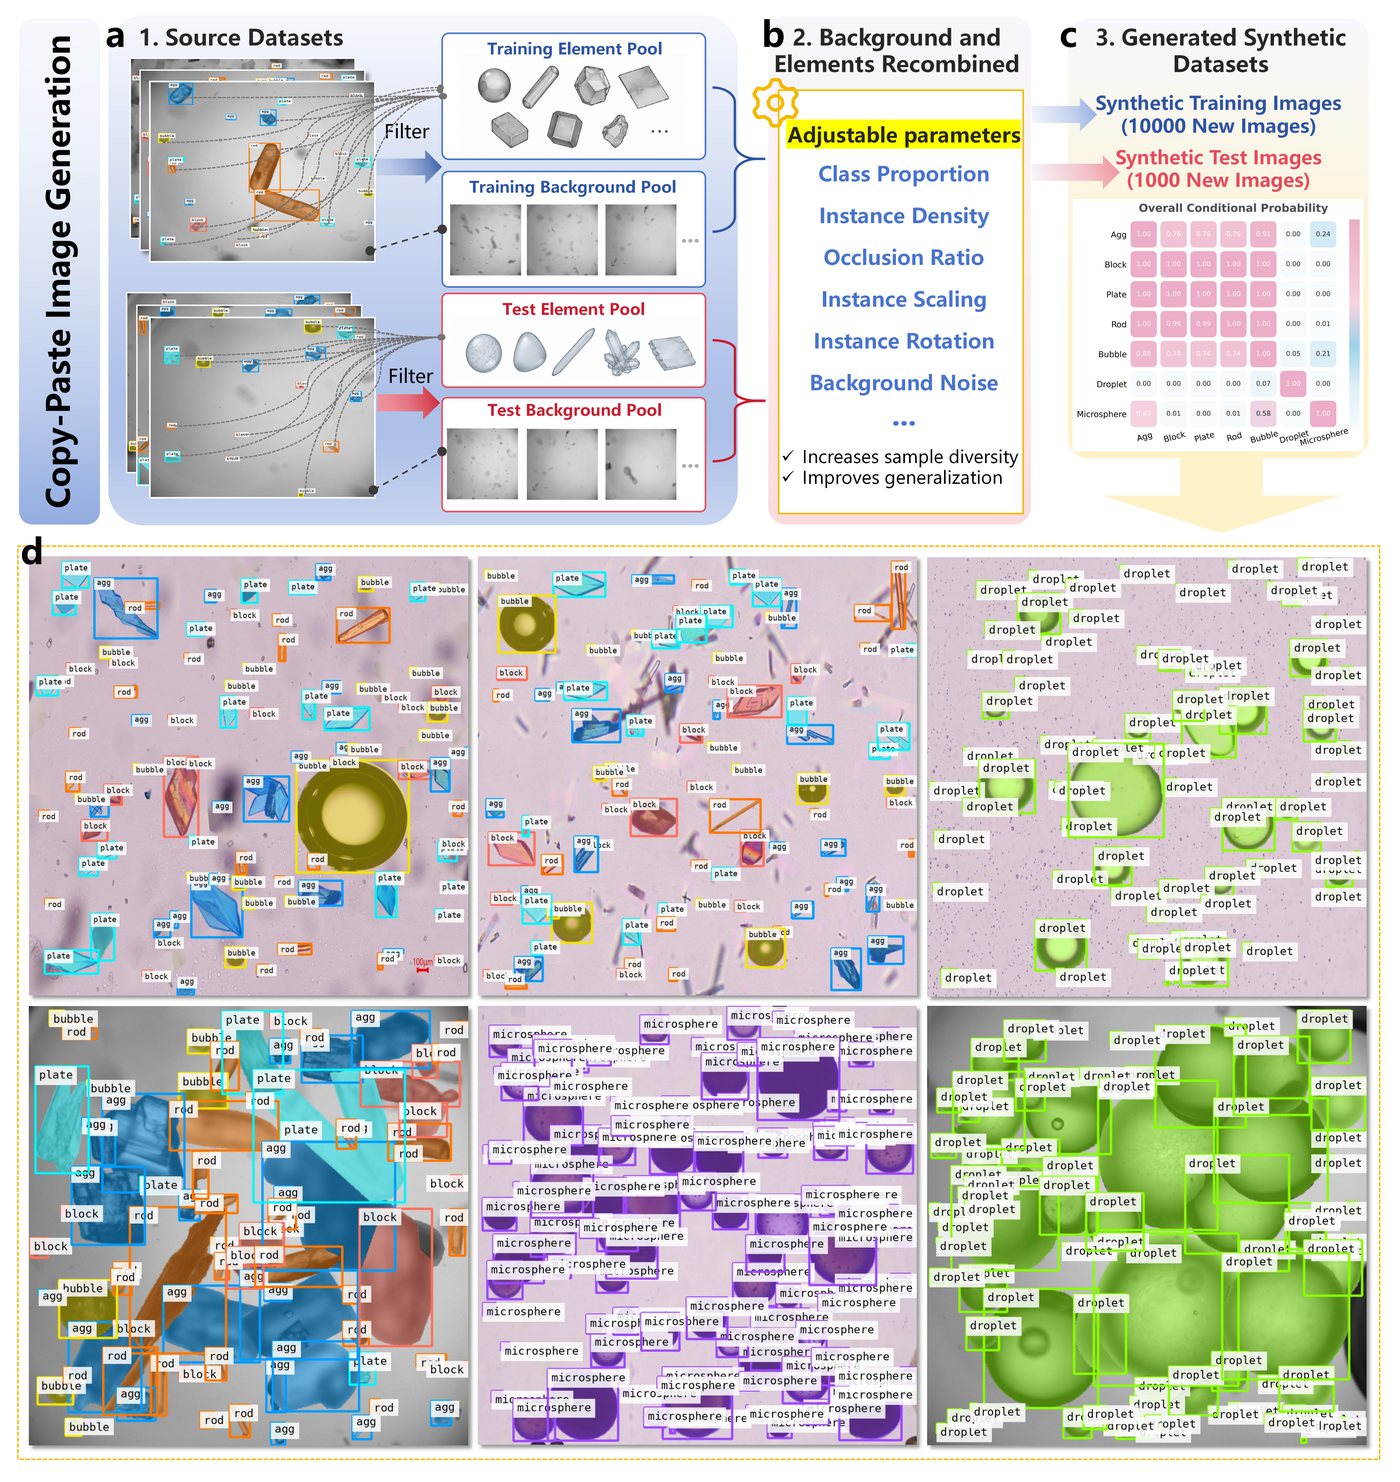
Synthetic complex scenes improve robustness while preserving real-test performance.
Deployment Model
After systematic benchmarking, Detectron2 was selected as the deployed model because it provides strong mask accuracy, stable high-IoU performance, lower model size, and easier integration into the MicroVision web workflow. Grounded-SAM-style pipelines can produce smoother boundaries in selected cases, but their larger model size and multi-stage inference increase deployment cost.
Detailed comparisons of all models are summarized in the benchmark results section of the main text.